All About Positive Experience!
CASY Software
Web-based Application
Touch Screen Devices
Redesign
Project
The Cell Counter & Analyzer CASY, is counting a wide range of cells. With variable cell size from large stem cell aggregates to small yeast or bacteria. CASY’s cell counter and analyzer technology gives all-round information about your cells in a very short time. In 2018, CASY was launched as combining the existing superior measurement principle with an analytical software. In 2022, The whole software has been redesigned into the web based, multi-device application. The new CASY Software comes in 2 versions. The Control-Version includes all functions to control the instrument and also allows analysis of the generated data. The Analysis-Version equals the other version but without the instrument control module. The application has been tested in each sprint with the laboratory technicians and Scientists to find out the best solution.Some highlights of the new software include:
- User Management (3 different user levels)
- Analysis of single measurements, Overlays or even Mean results
- Unlimited number of templates
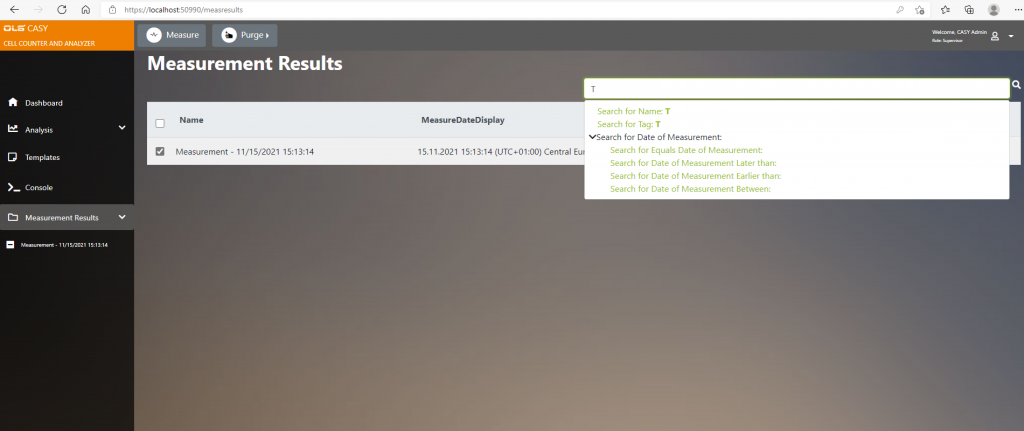
- Organized results
- Reporting tools (customizable)
- User Support by wizards, like start up or shut down guide
- Active Directory user management
My Role
UX – UI designerChallenge
This project has been, not only, a design refresh but also a product redesign in terms of comprehensive research-based improvements under the hood. That involved a deeper-level approach to create a solution that user need and missing. It addresses business logic, product functionality, architectural design, and other core elements. As the first UX designer at the company, I recognized the importance of establishing clear lines of communication with colleagues and stakeholders to define the role of a UX designer within our organization. Given the upcoming launch of several projects, I have taken the initiative to develop a comprehensive design system that will ensure consistency in the visual identity of the company across all initiatives.Research
Information gathering: Over the course of 1 moth, I worked with the business stakeholder to understand and prioritize interview goals and topics to explore. They also developed a discussion guide to help conduct the interviews based on those goals. This also include 3 learning sessions, which gave me chance to learn about the product and its functionality. Insights gathered through speaking directly with scientists in their work environments helped to develop solutions.
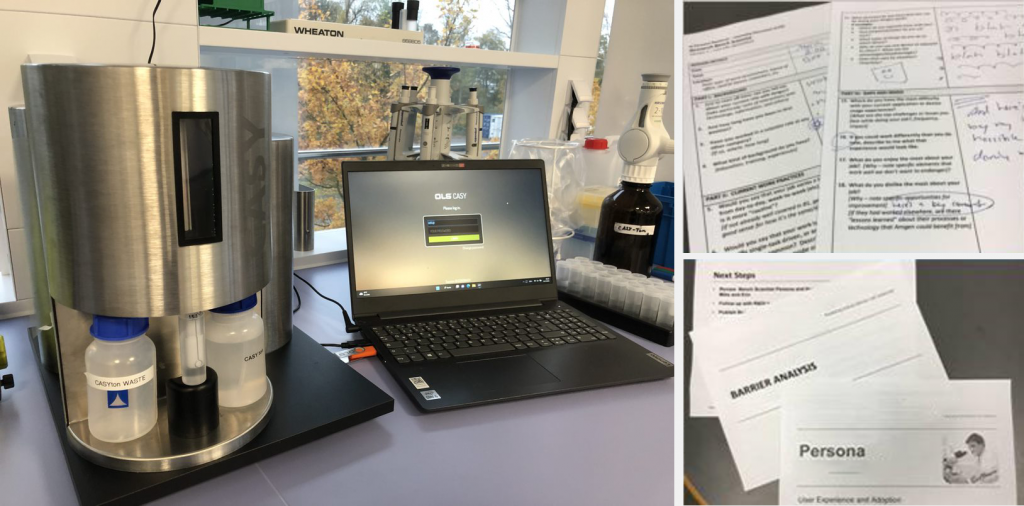
Interviews: A total of ten interviews were conducted over the next two weeks. These interviews were face-to-face in the office/lab. With permission, I recorded the sessions using a portable voice recorder and took additional notes. In some cases, they also toured their labs and I took a few photos, which really helped to see what the specific environment is like, that the product is being used.
User-Meeting Series: User meeting is a one-day interactive event to welcome end users in house. The goal of this meeting is to ensure that users are updated with current or emerging technology, as well as giving you the opportunity to user to exchange the experiences of using the product in real-time, impedance-based systems with fellow scientists and field experts. This one day event is a great chance to collect insight and find out the user’s pain points.
Interview and data analyzing: After each interview, I reviewed the recordings and compiled more detailed notes. Once all the interviews were complete, they identified common themes, unexpected insights and followed up for clarification as needed.
Findings
Through the research, I learned about the brand and product. The findings and persona were ultimately used to make decisions around the redesign of the product to better enable collaboration and maximize the efficiency.
- Most scientists believed that collaboration fosters innovation and that the lab is where they have the best opportunity to connect with other researchers. Having the opportunity to share the extracted data is essential.
- Additionally, the scientists need a personal space to review information and data on screen.
- Also, I found it very difficult for scientists to manage data scattered between paper, desktop computers, and labs, and redundant data entry. These difficulties increased error rate in data, made scientists inefficient, and contributed to a generally unsatisfying experience.
- To have a more free accessibility to all the lab space and sometimes to control the device or having access to data out of the lab, the possibility of multidevice app seems important.
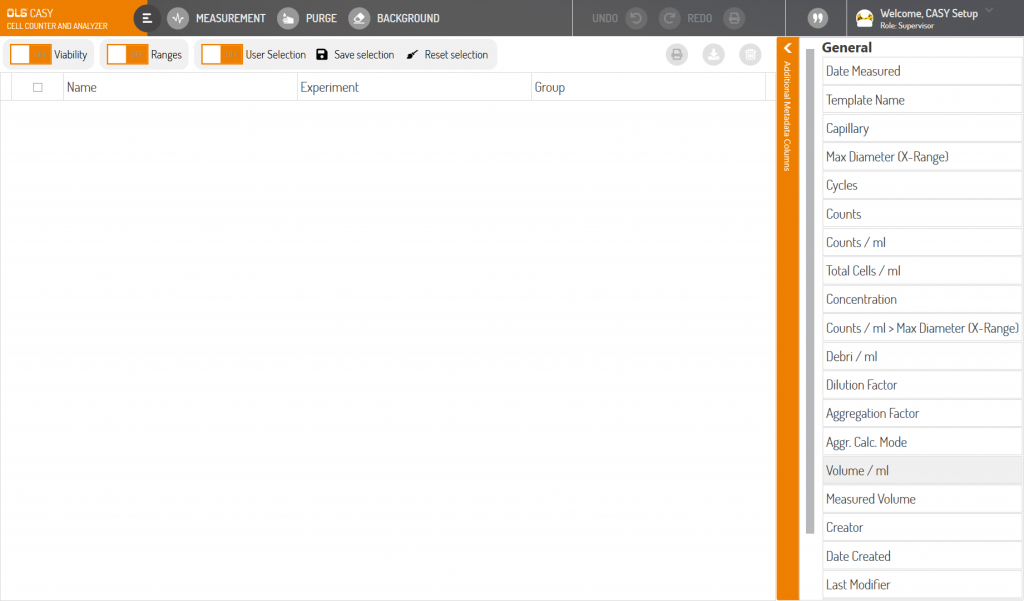
- On the old software, technician need to have access to some feature that has been impossible, giving access to all these features and elements on one screen is requested by users.
Design Process
Software analyzing: The current state of the software has been analyzed to find out the problem.
Report and Feedback loop: The final report was delivered to the business stakeholder in about a week and included findings and recommendations, along with key quotes (anonymized). The findings and persona were ultimately used to make decisions around the redesign of the digital product to better enable collaboration and maximize the efficiency.
Iteration: I have reviewed and iterated the results with the scientists until a solution was developed that worked for them.
Software Status Quo
Iteration
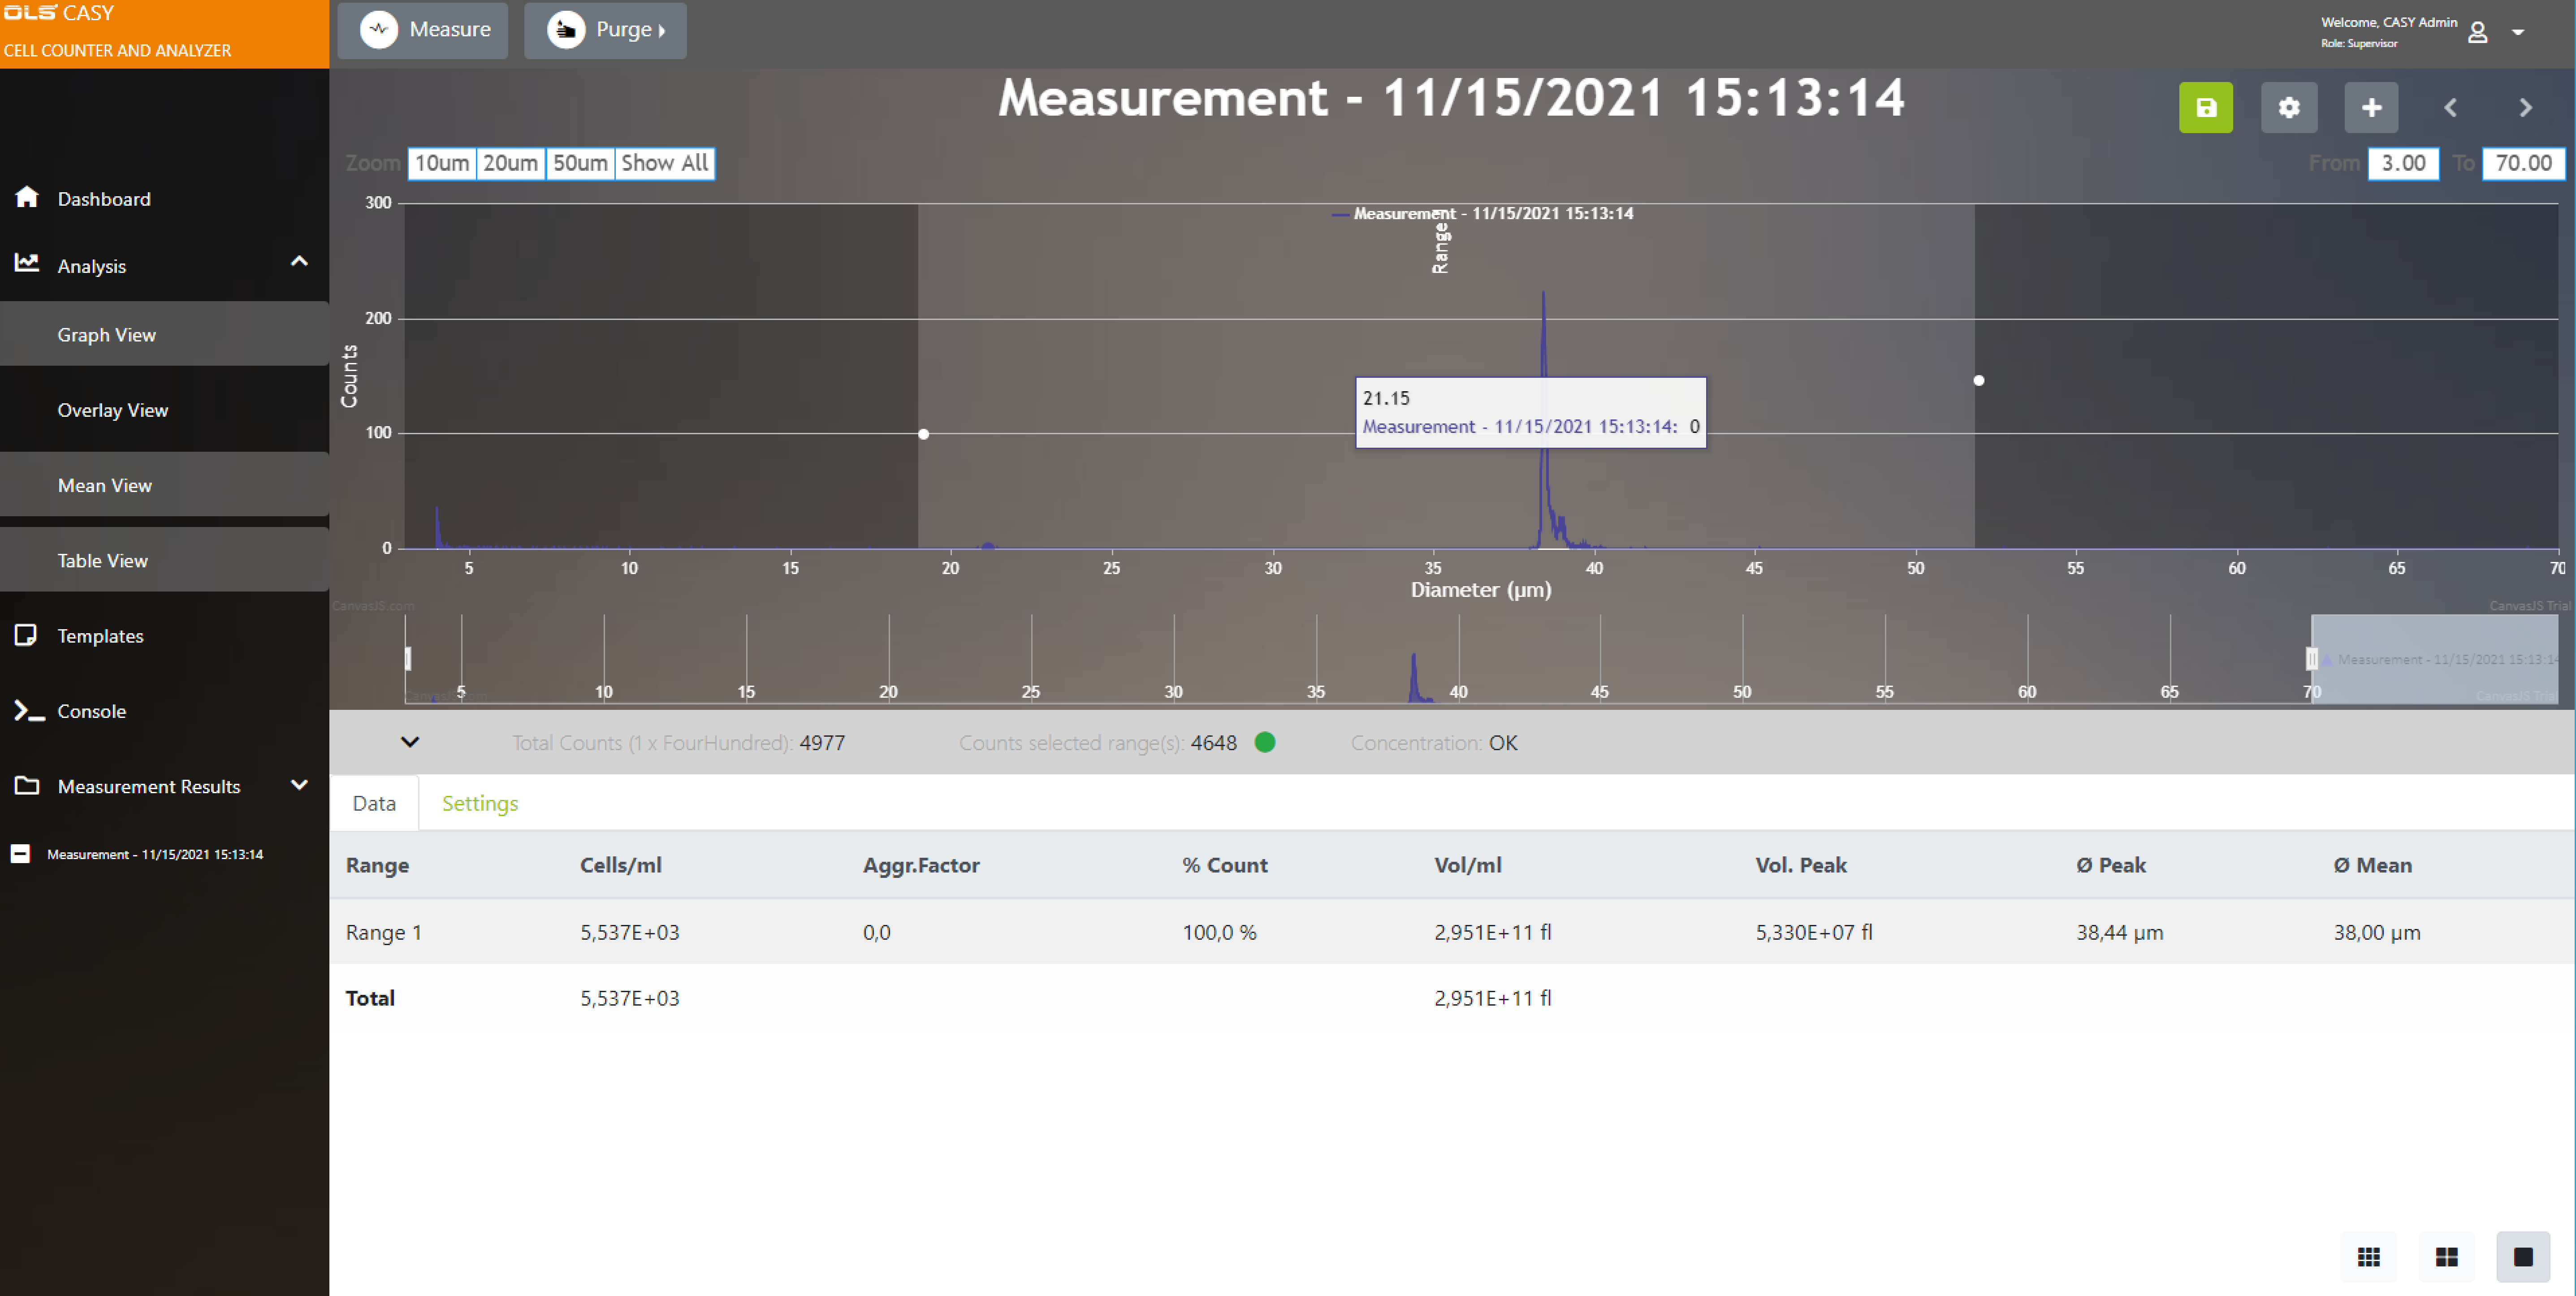 Old design
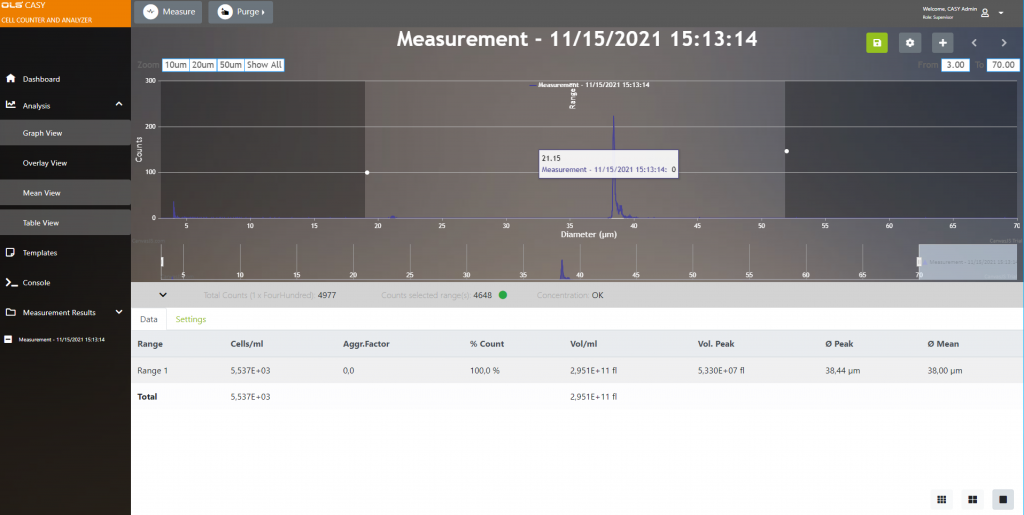
One of the issues that came out after testing, was users interactions with the measurement function. Users report they need to see the data chart and the graph simultaneously on the page. Scrolling in page or between tabs in order to have access to different settings is decrease their efficiency.
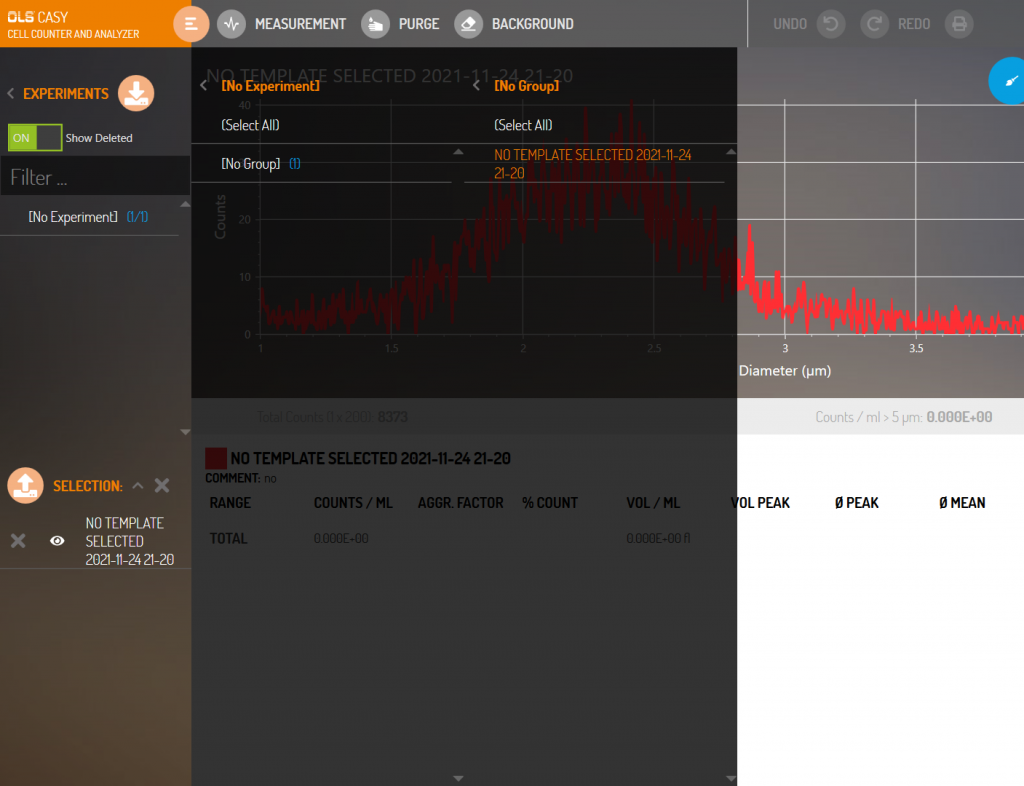
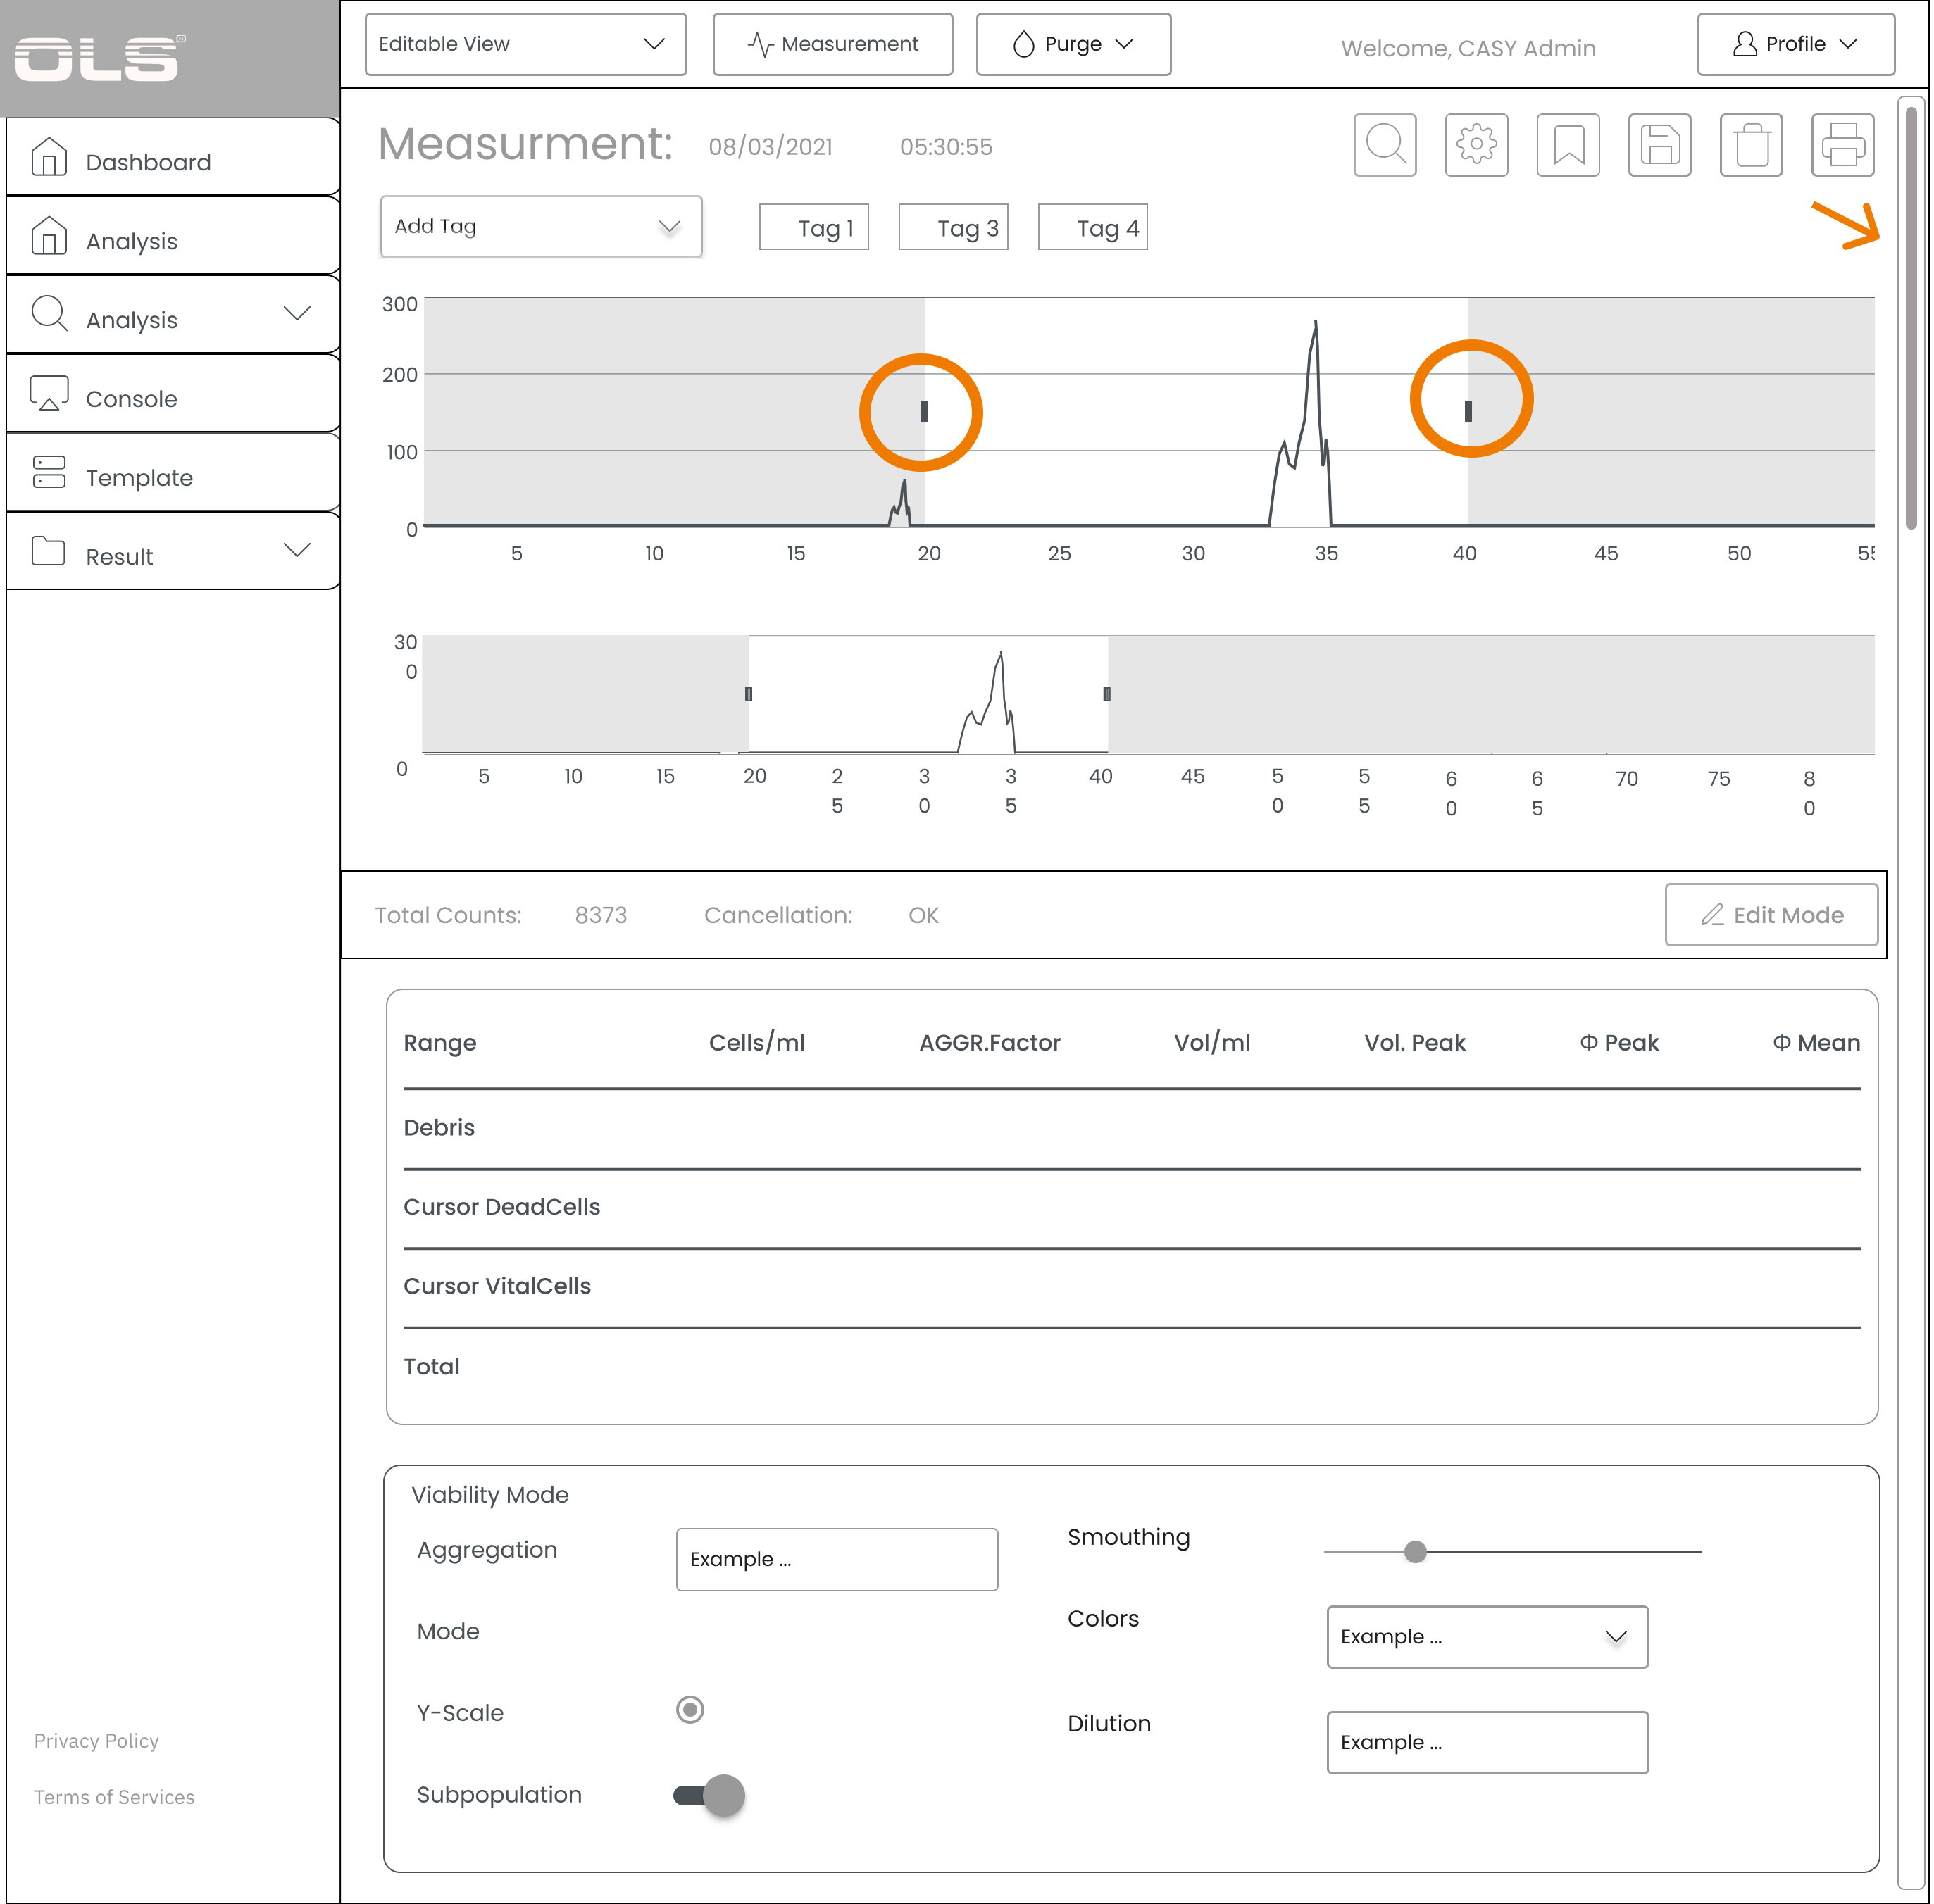 1st Iteration – Scrolling – Range cursor on graph
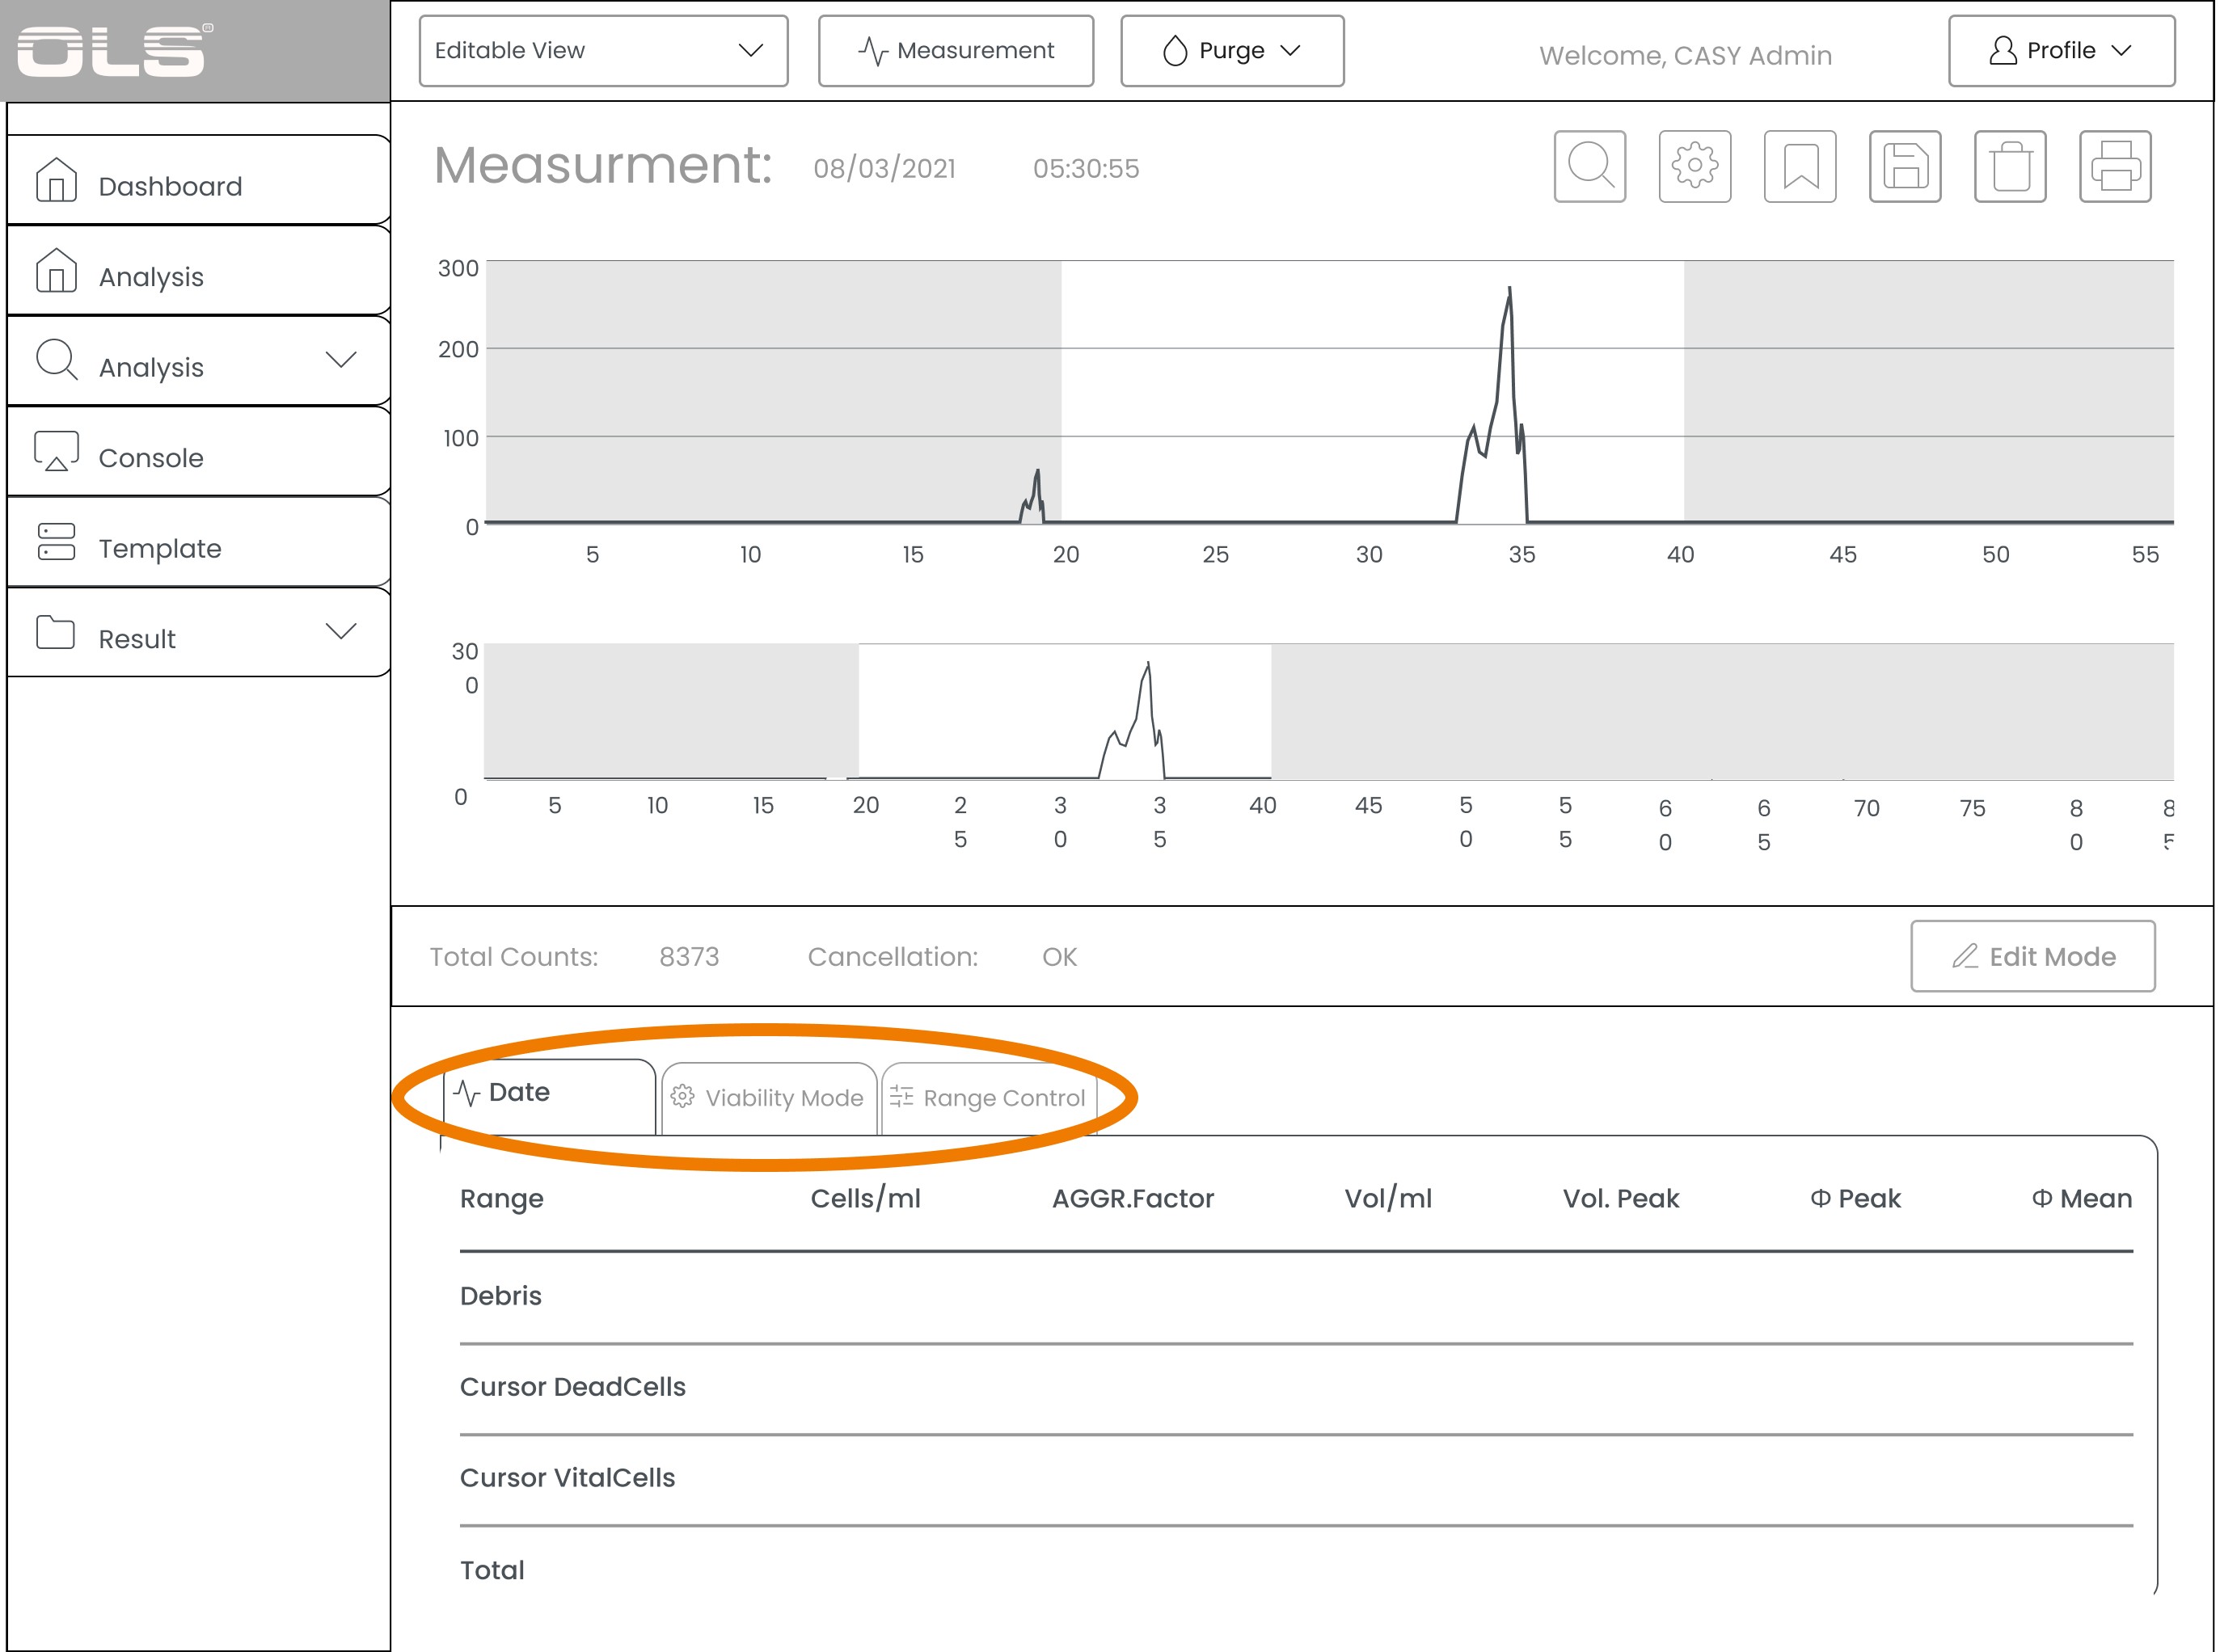 2nd Iteration – Navigating through tabs
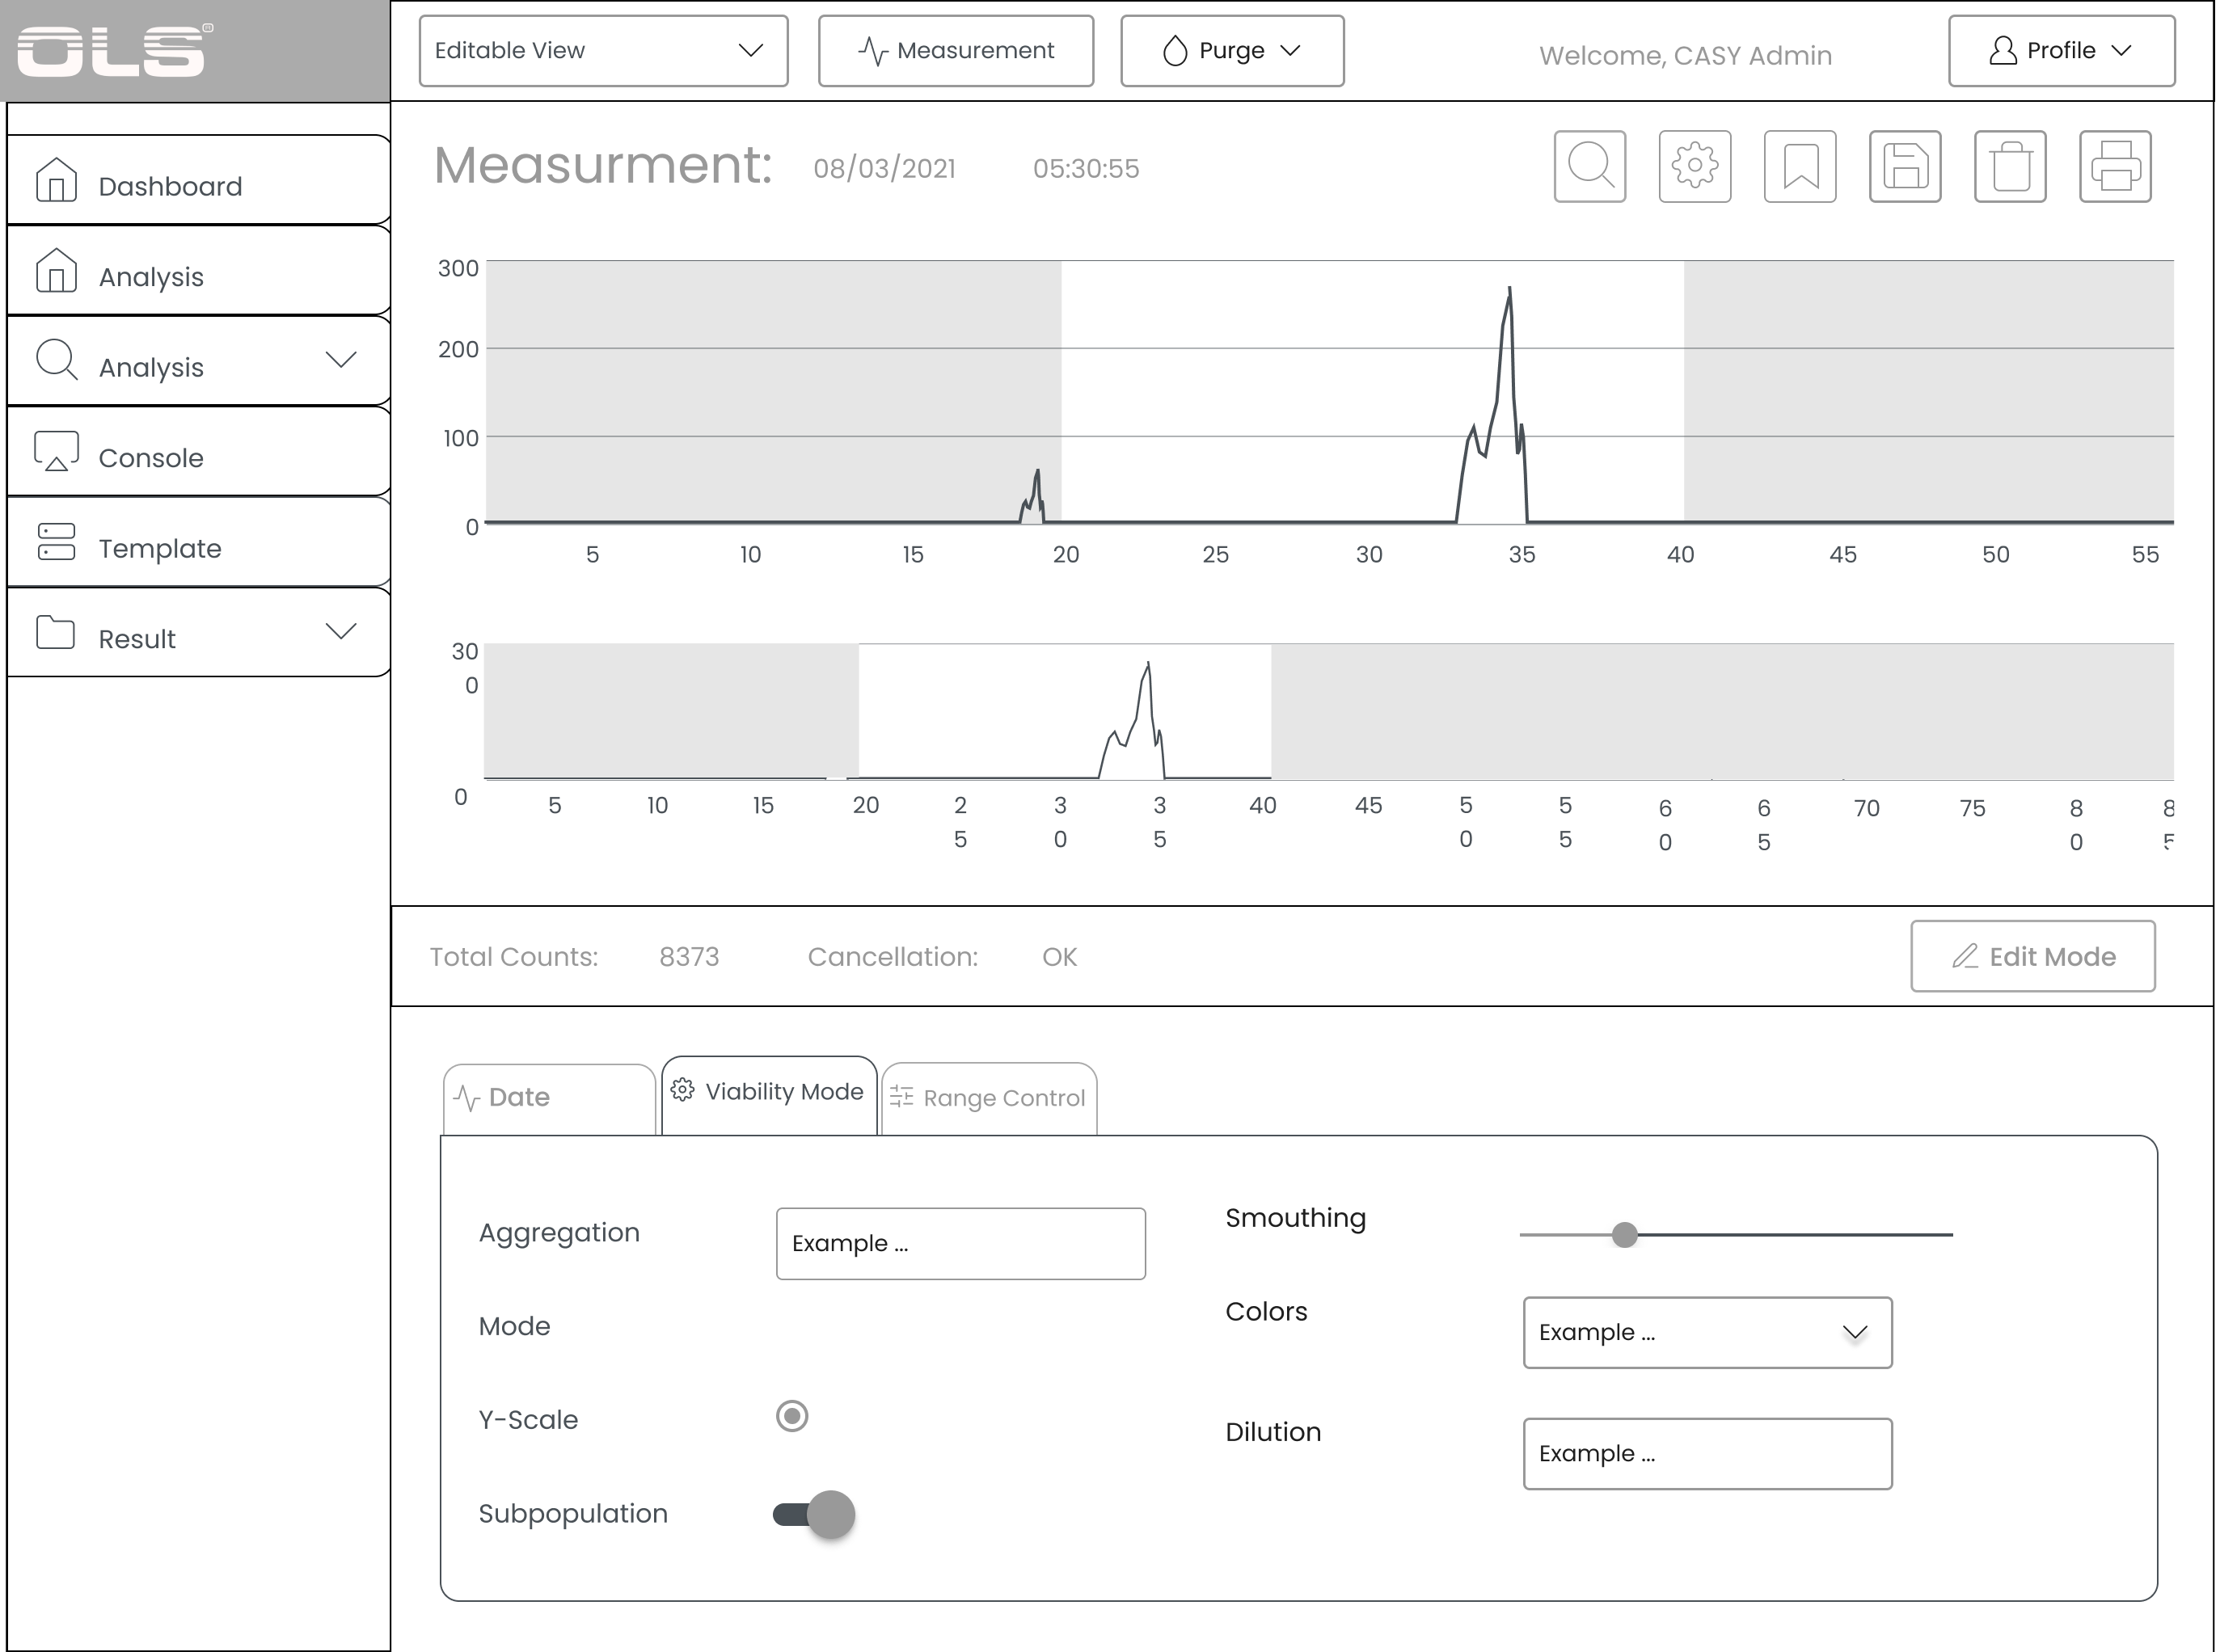 2nd Iteration – Navigating through tabs
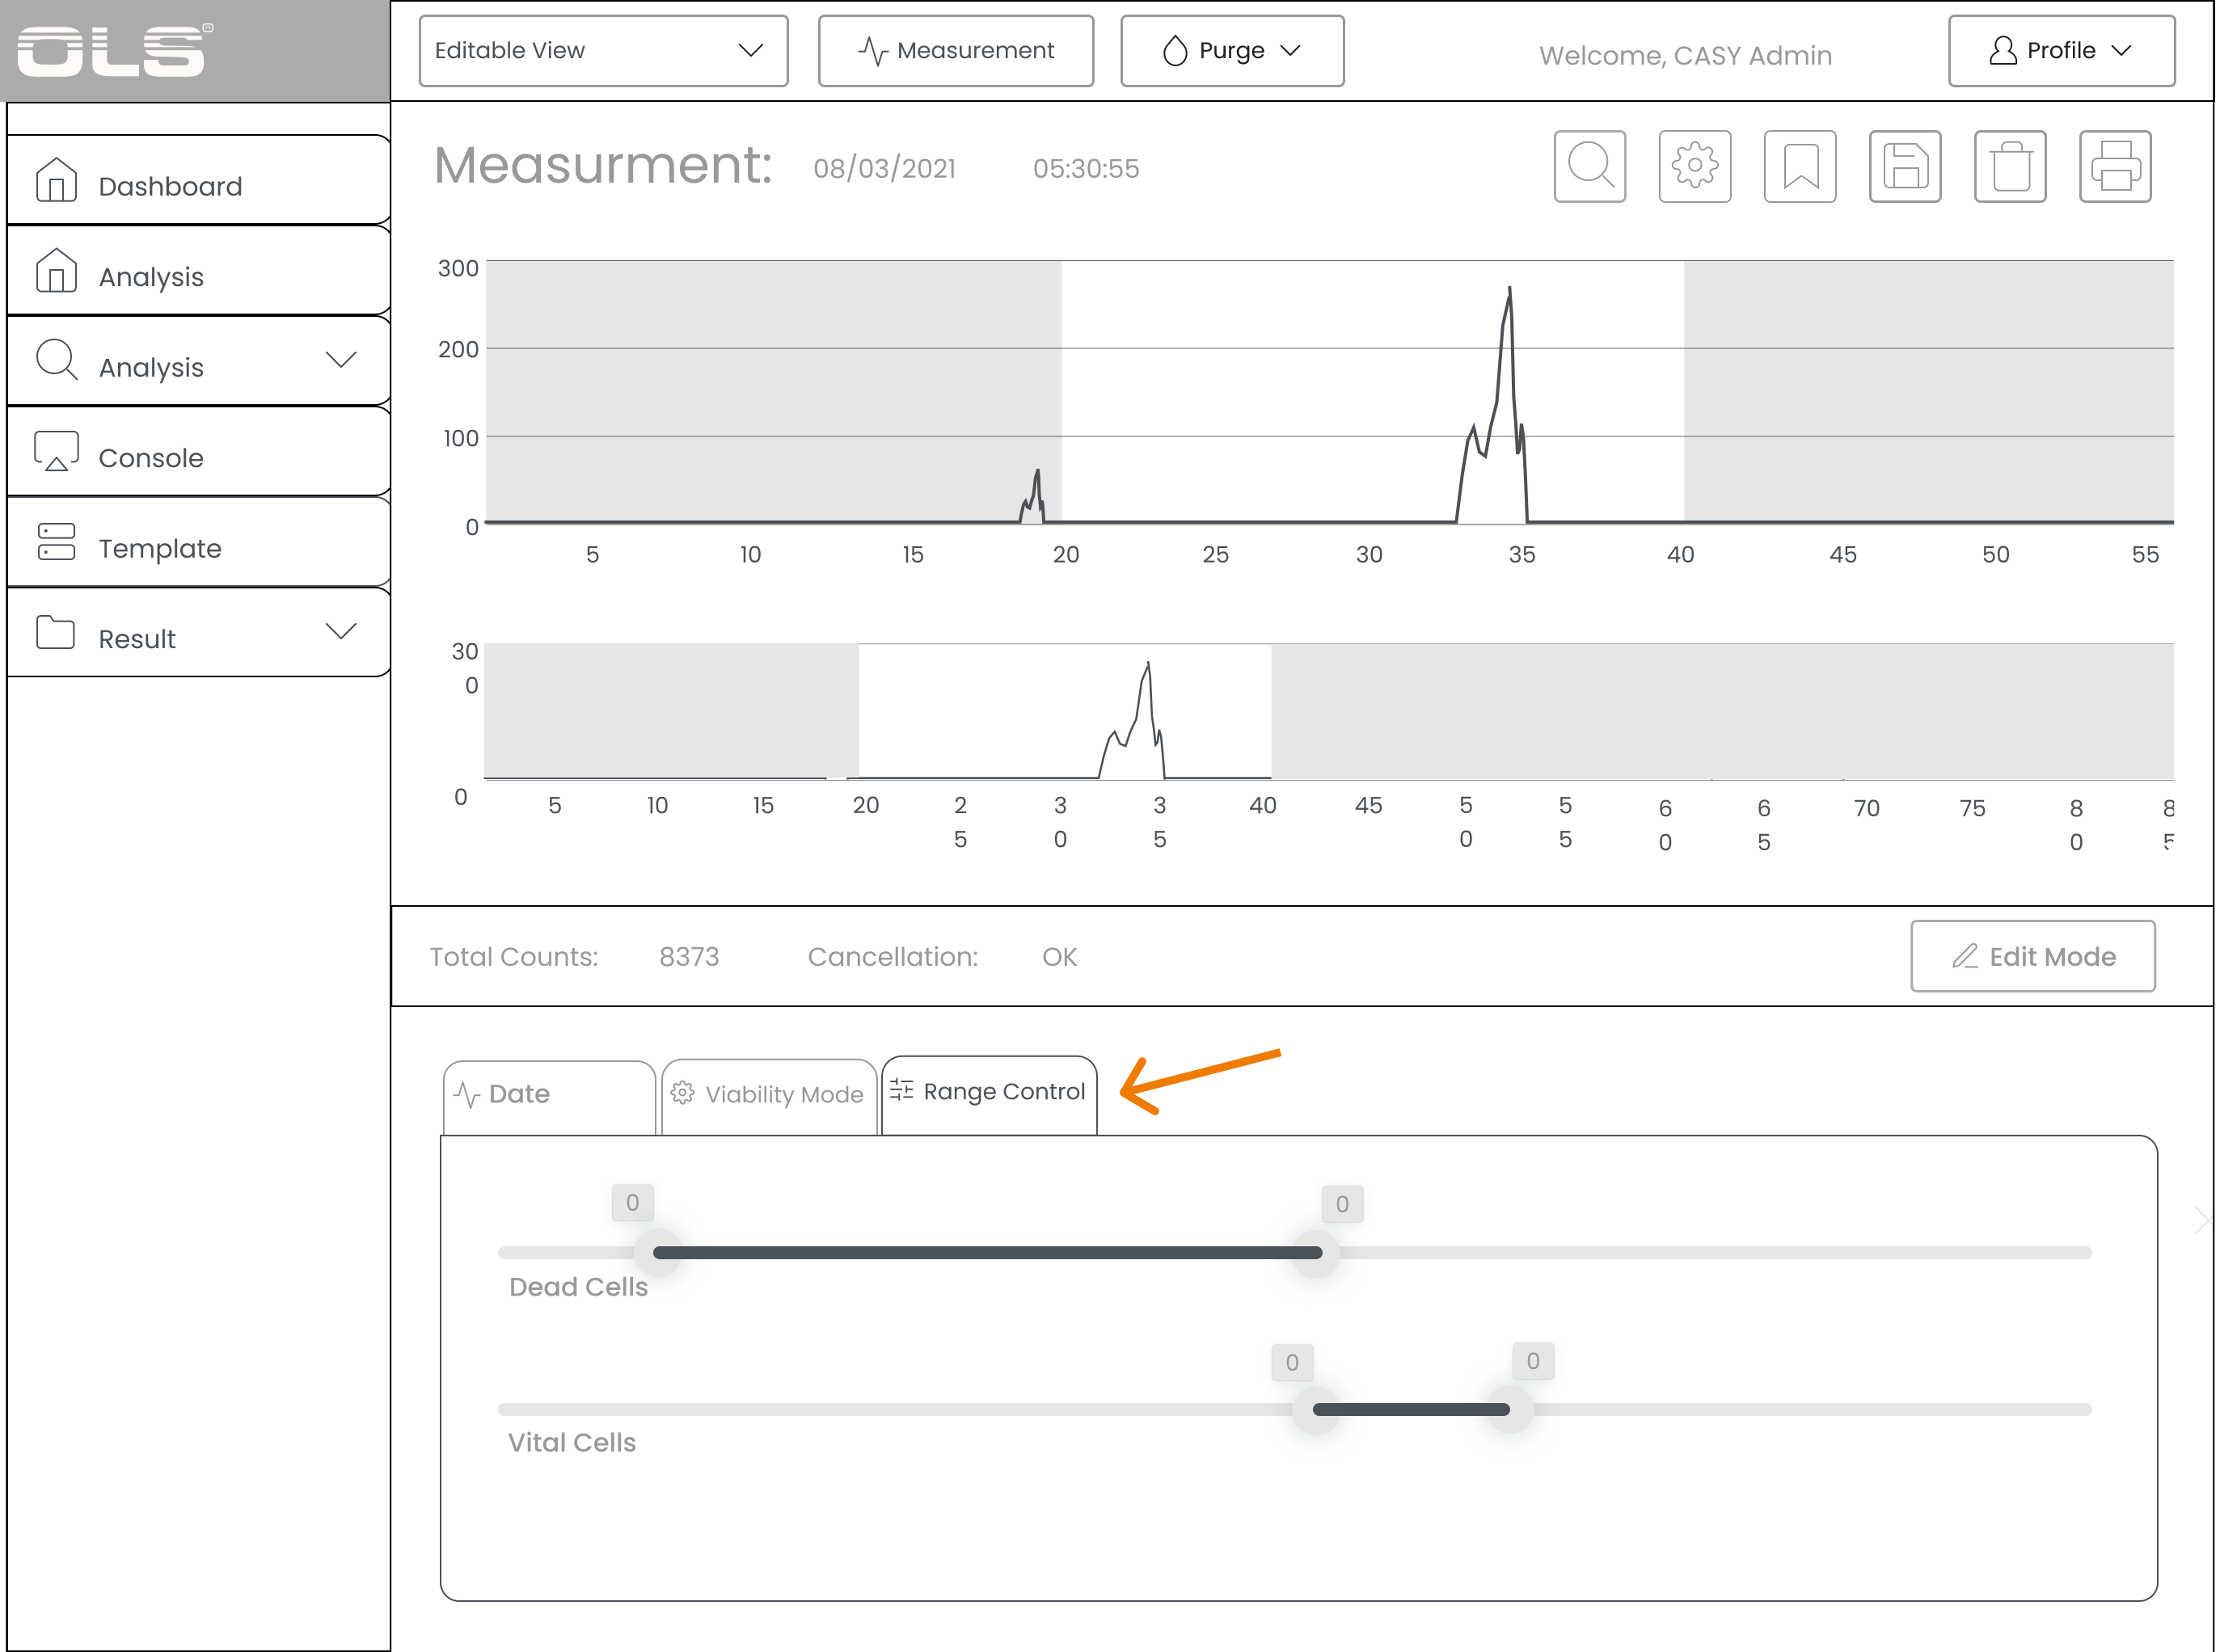 2nd Iteration – Range cursor
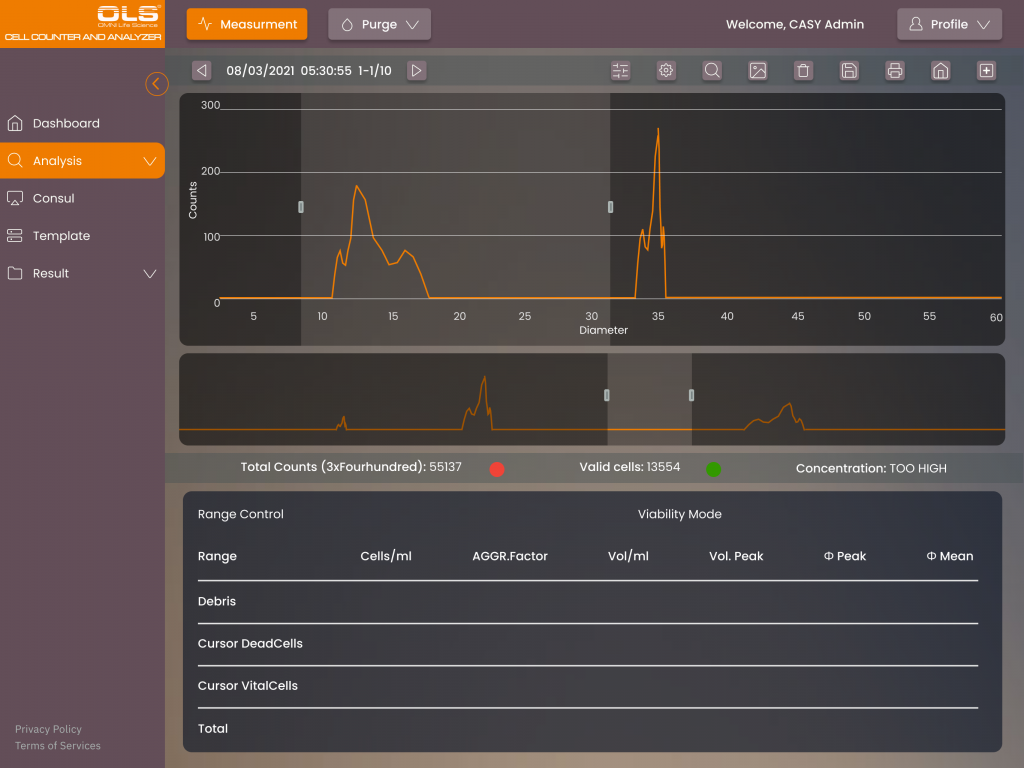 Final result – High fidelity prototype
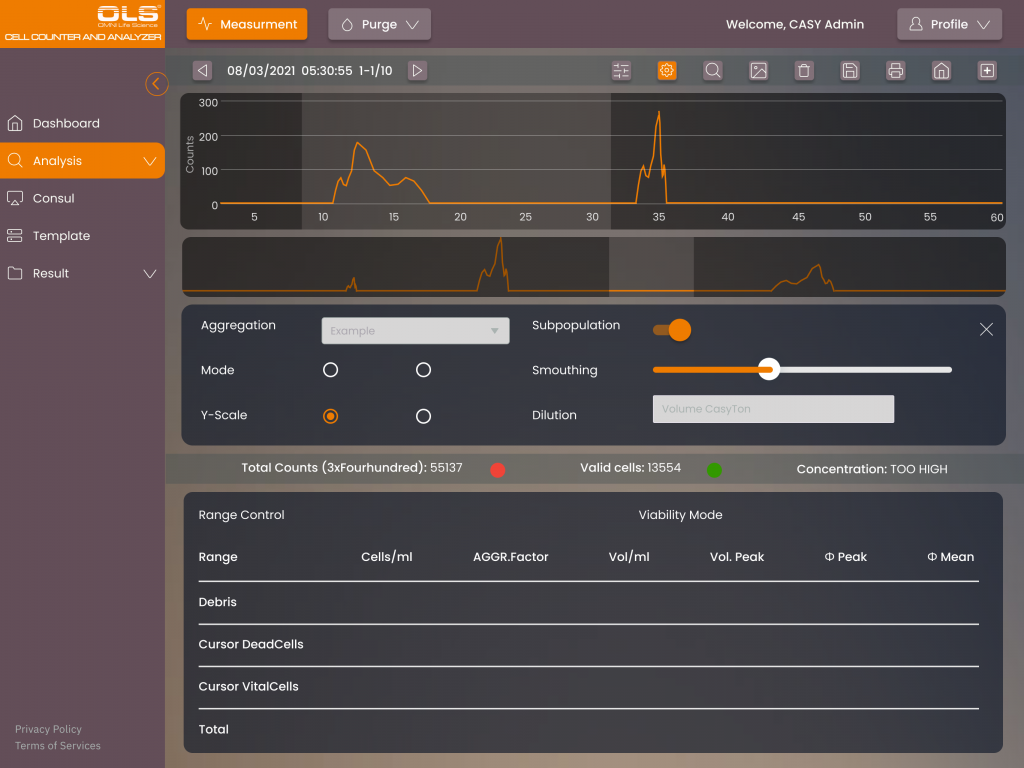 Final result – Squeezing the graph
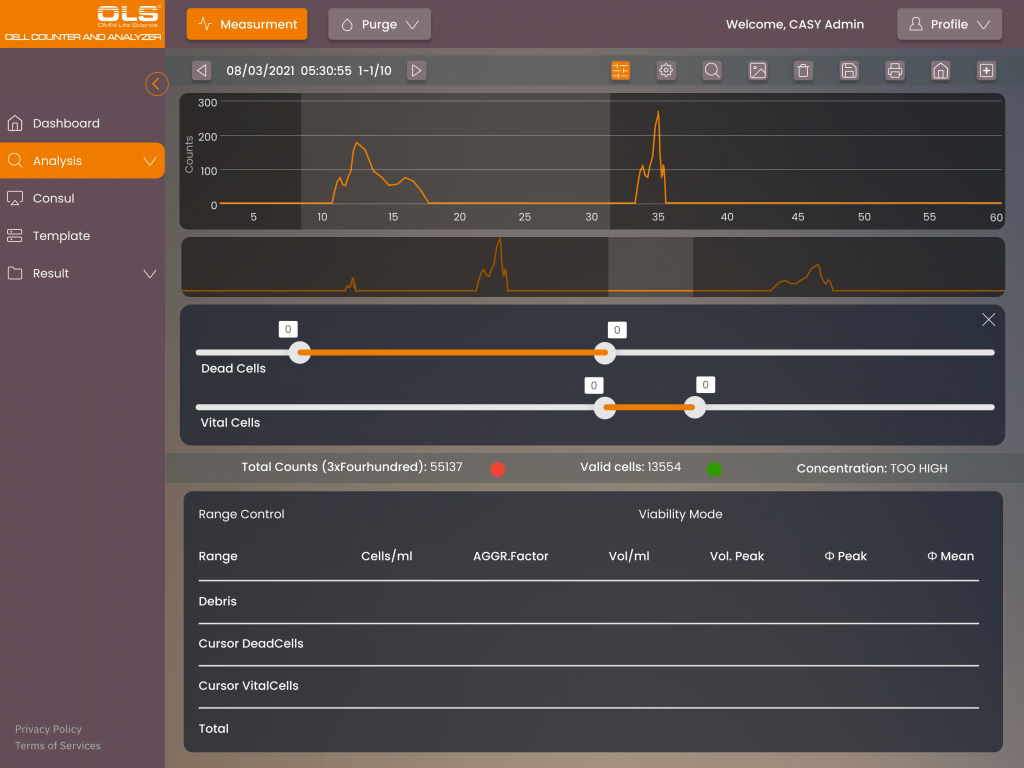 Final result – Range cursor
Redesign
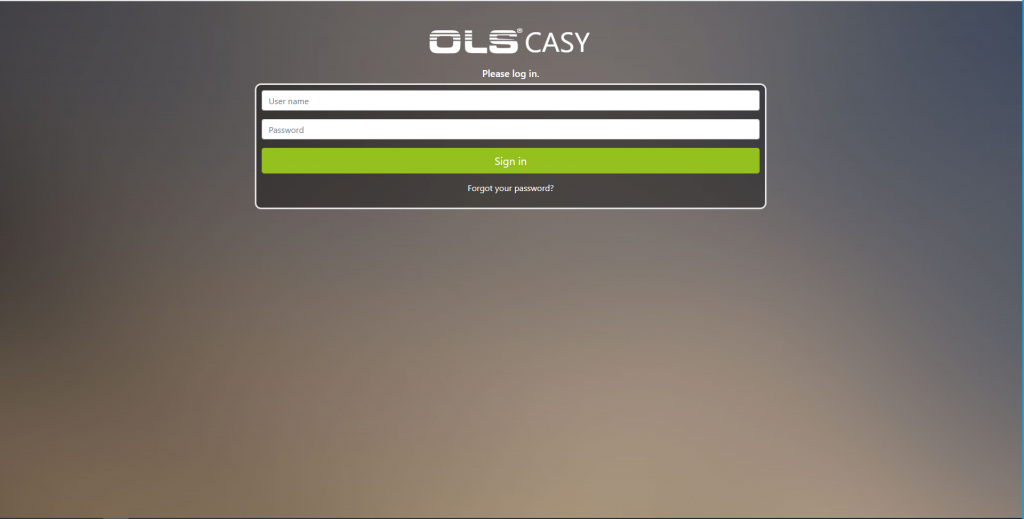
Log in
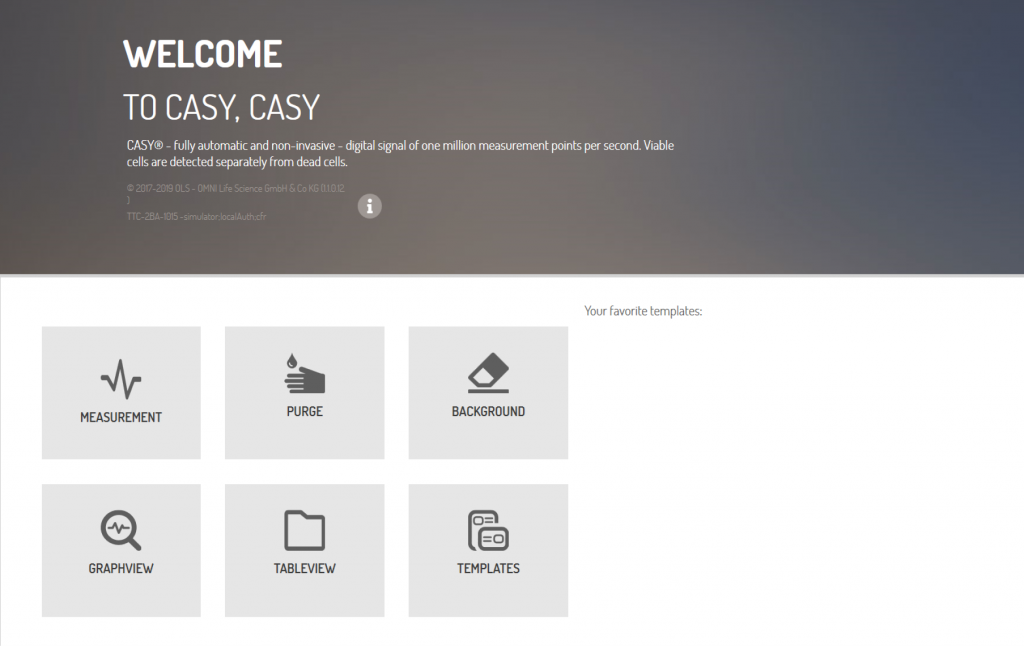
Dashboard
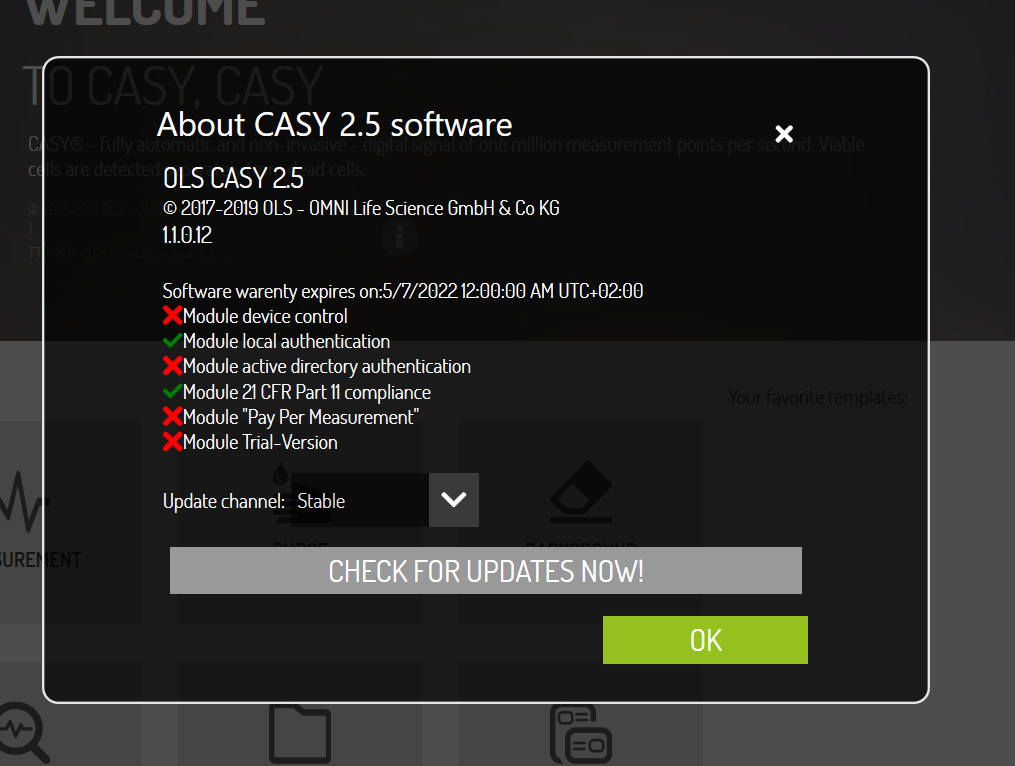
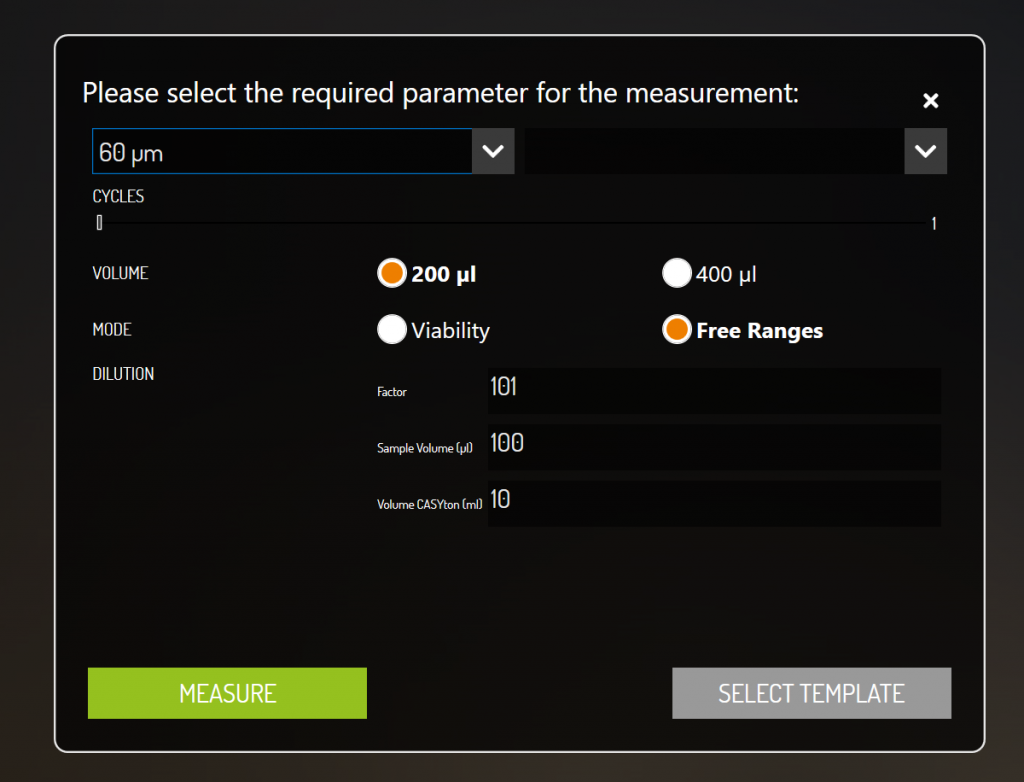
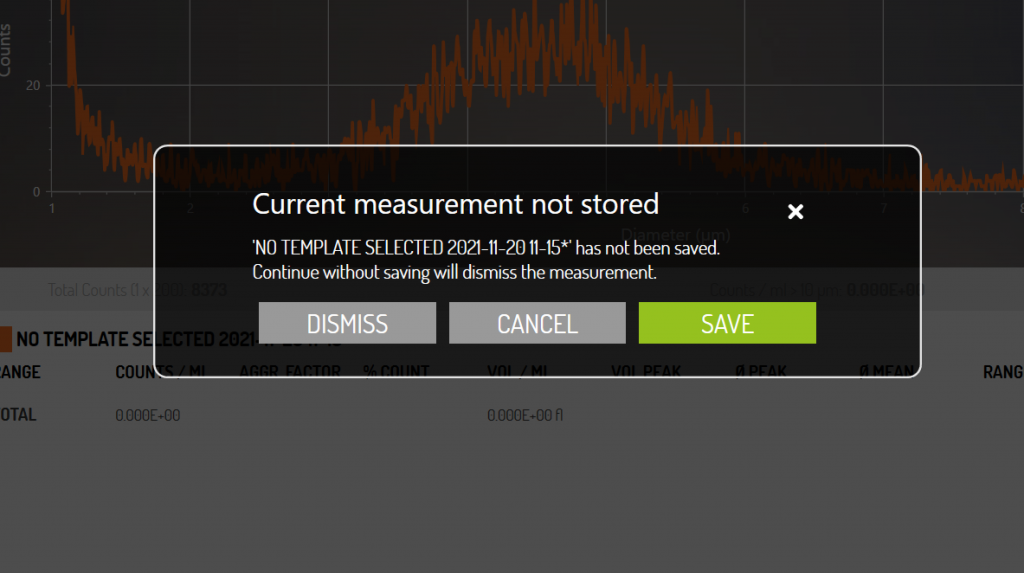
Pop-up Dialogs
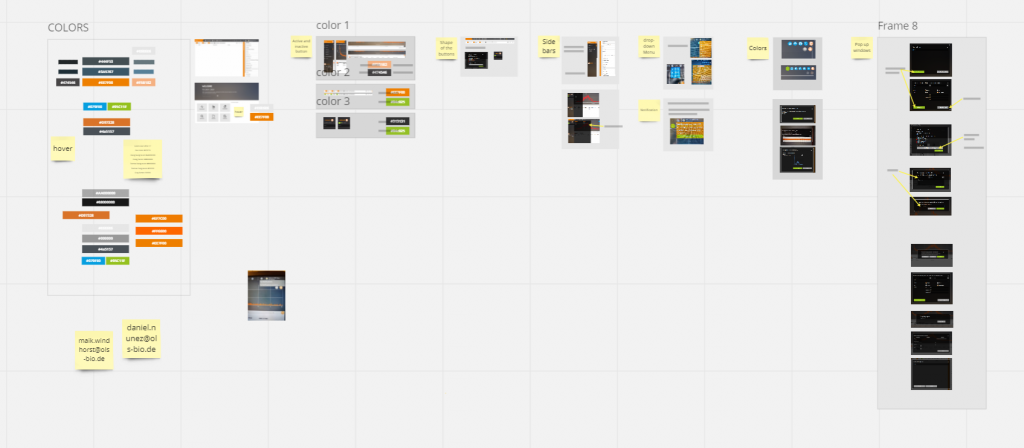
Design System
Prototype
This project has NDA. Here is few sample of this application’s features in Figma: