All About Positive Experience!

E-commerce Mobile-website

Check out the final prototype in Figma.
Project
ARNETTE has the objective to increase its global presence, establishing itself as the main-stream street-style, sustainable and positive brand for generation Z. This project has tried to keep the brand promises and be focused on the target group of the brand.My Role
My role: Research, Interview, User flow and Prototype, as part of the team: Yourino, Kristi, Sladjan, Hourieh The project has been done in close collaboration and under supervision of Luxottica Design team.Challenge
The primary goal has been set as having an online space where brand can tell and describe the collections in greater depth and give the consumer a clearer picture of who is ARNETTE, what is ARNETTE doing and which are the values that inspire and guide ARNETTE. Besides, driving users to the ARNETTE e-commerce website has been a key-point in the brand communication. Though, Landing Page Entrance Rate was unknown and needed to be monitored and regarding the target group’s age range, it was necessary to find a tailored strategy to keep a high rate. On the other hands, ARNETTE was encountering Low Conversion Rate. The reason wasn’t clear.Research and Findings
– Photo by Sayan Ghosh
– Quantitative data:
Methods and Tools:
Google Analytics and Desk research
We have started with analyzing the website performance followed by a highly intense desk research about the user target and brands objectives. Here are some of the results:
• The website was facing a conversion rate of 1%. Which was considered a low end for e-commerce and was concerning by the stockholders.
• Google Analytics shows data on entrance rates for landing pages of 28%. Since Gen Z is typically digitally savvy and values sustainability, this rate is considered relatively low.
• Gen z are over 40% out of all consumer shopping, but Goal-oriented and don’t surf the web aimlessly. So they sometimes visit ecommerce websites in order to just build a wish lists.
• 82% trust a company more if it shows images of real customers in its advertising.
• 72% more likely to buy from a company that contributes to social causes.
• 73% have willing to pay up to 10% more for sustainability, and 56% might return or exchange a gift which is not sustainable!
– Qualitative data
Methods and Tools:
Benchmarking, Usability testing of competitors, Usability testing of status quo, Interview and Survey
After conducting user interviews and usability test with 5 users from the target group, Gen Z, and performing a survey on the final step of checkout process, we find out some more qualitative data that help us to empathize more with the user and find out the reason of some malfunctions on the website.
• Users report incorporate social proof elements. Considering reviews basically would be done in extreme situation.
• Users have doubt about the authenticity and transparency of brand on the sustainability.
• The materials are important to mention to encourage users to proceed to the purchase checkout.
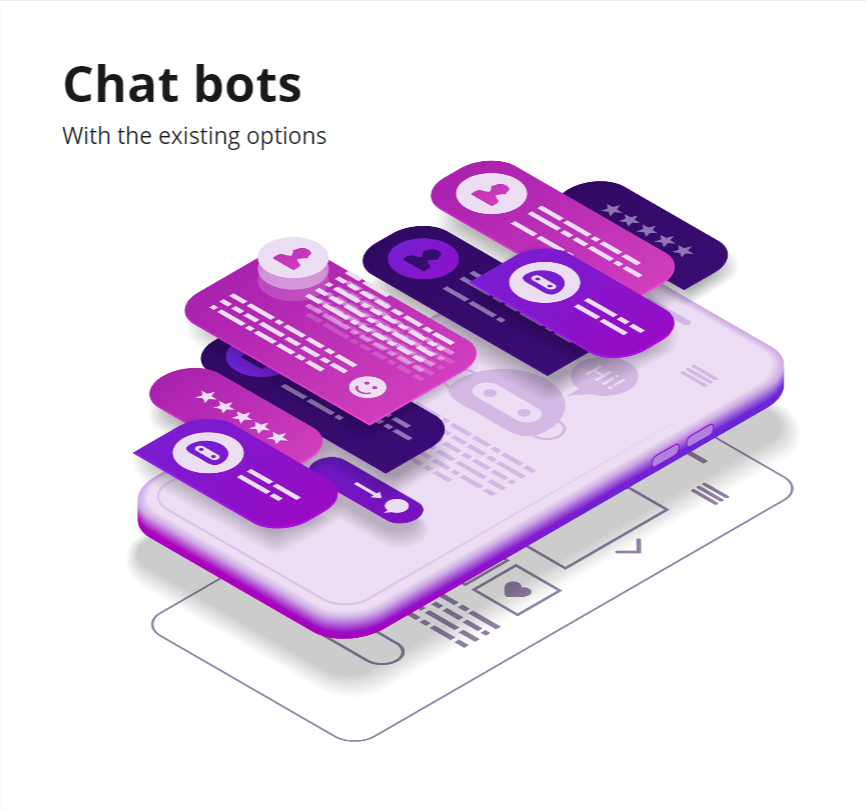
• Chatbot should be with some options to choose.
• Terms that describe the product should be clear.
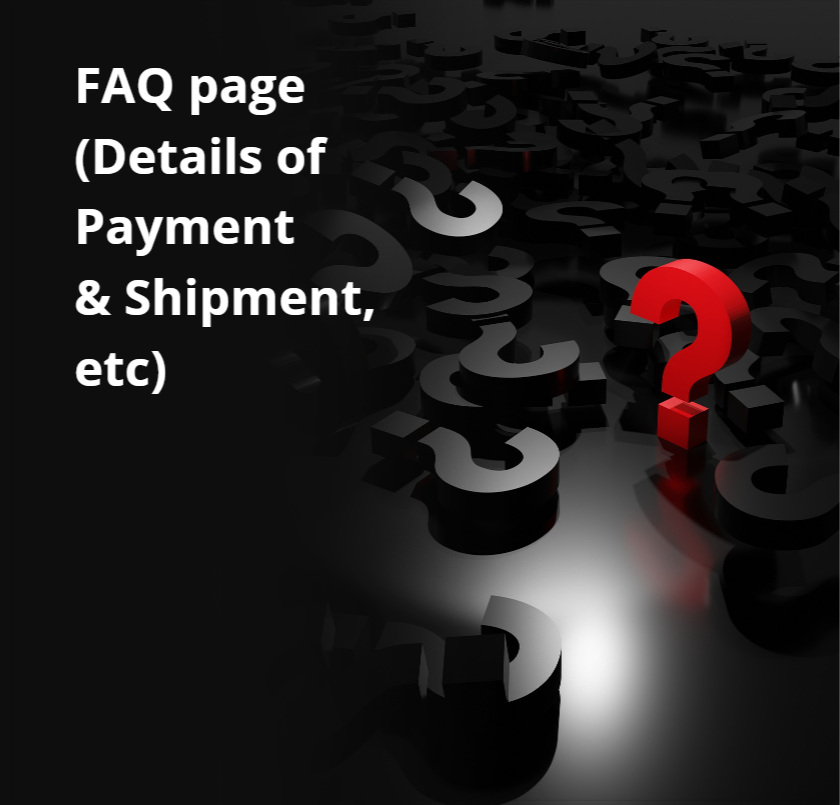
• It hasn’t been easy to see Delivery time & Prices.
• Monthly paying method is not likeable.
• Current packaging is likable.
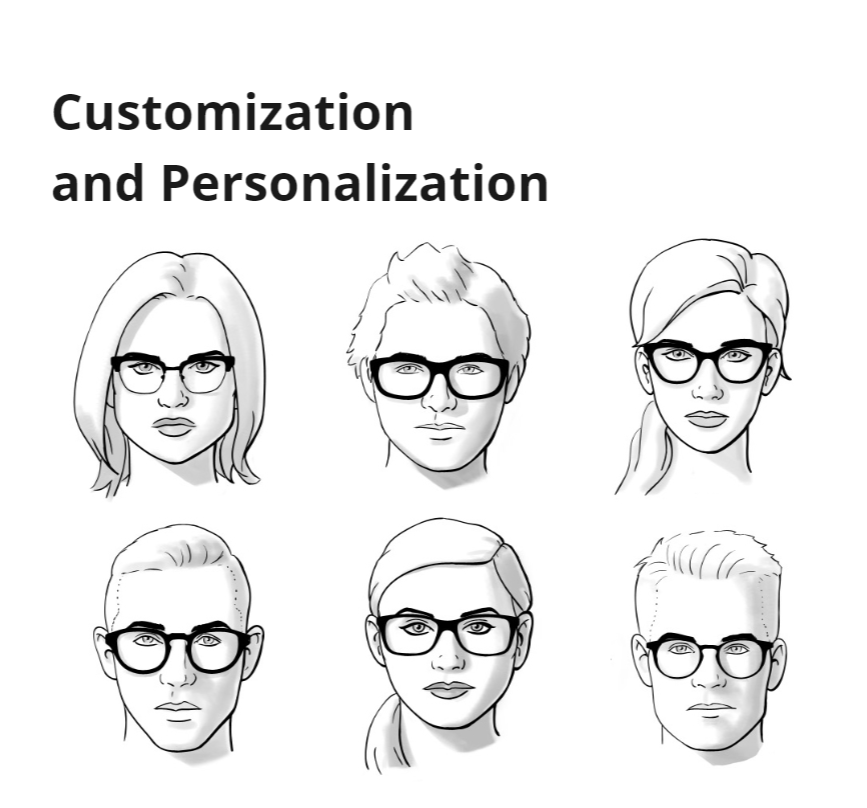
• Customization & Virtual Mirror options were really appreciated
• Mobile Optimization is required. Most of the users report they have no willing to check the webshop on any other device.
Empathize and Define
Based on the ultimate results, I used the tools, such as Persona, User Journey, Value Preposition Canvas, to understand the different types of users more.
– Persona
In order to synthesize the data collected into representative profiles that encapsulate the needs, goals, and behaviors of the target users, It was necessary to identify patterns and themes.
So the research data carefully analyzed to identify commonalities, patterns, and recurring themes among the target users. And the result is refined by adding more detail and depth to their attributes. This includes demographics (age, gender, occupation), psychographics (goals, motivations, frustrations), behaviors (habits, preferences), and any other relevant characteristics.
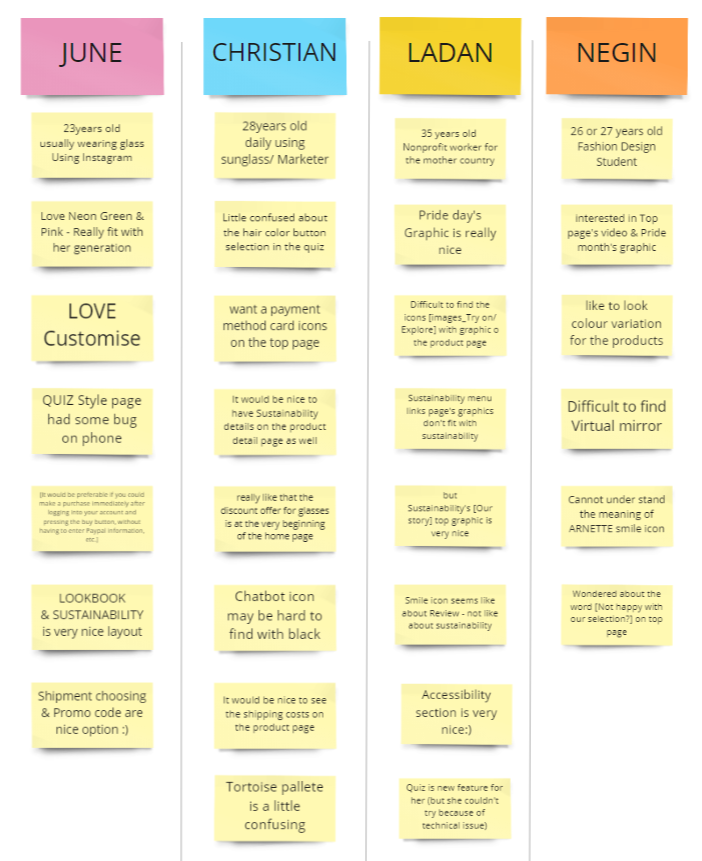
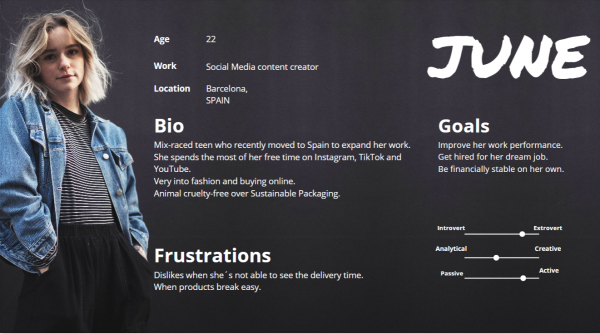 Persona: June
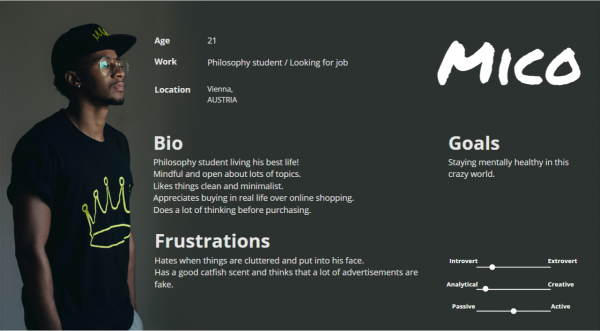 Persona: Mico
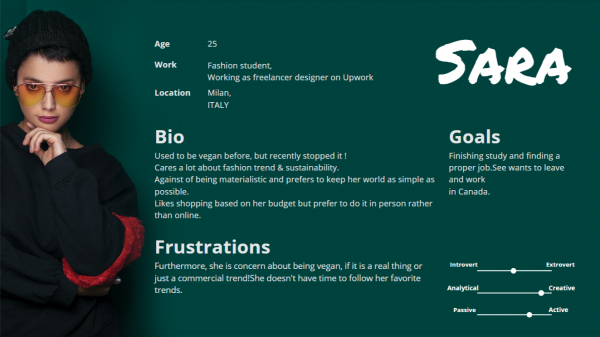 Persona: Sara
– User Journey
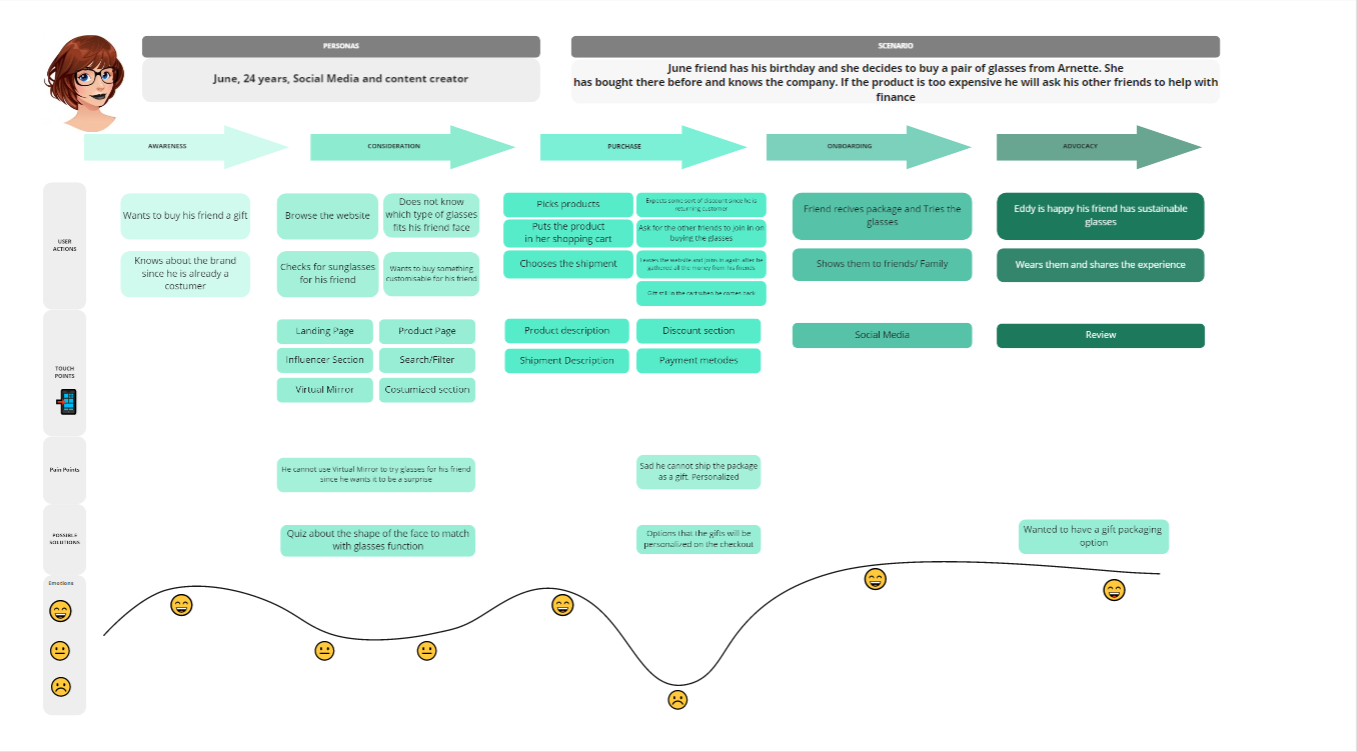 User Journey: June
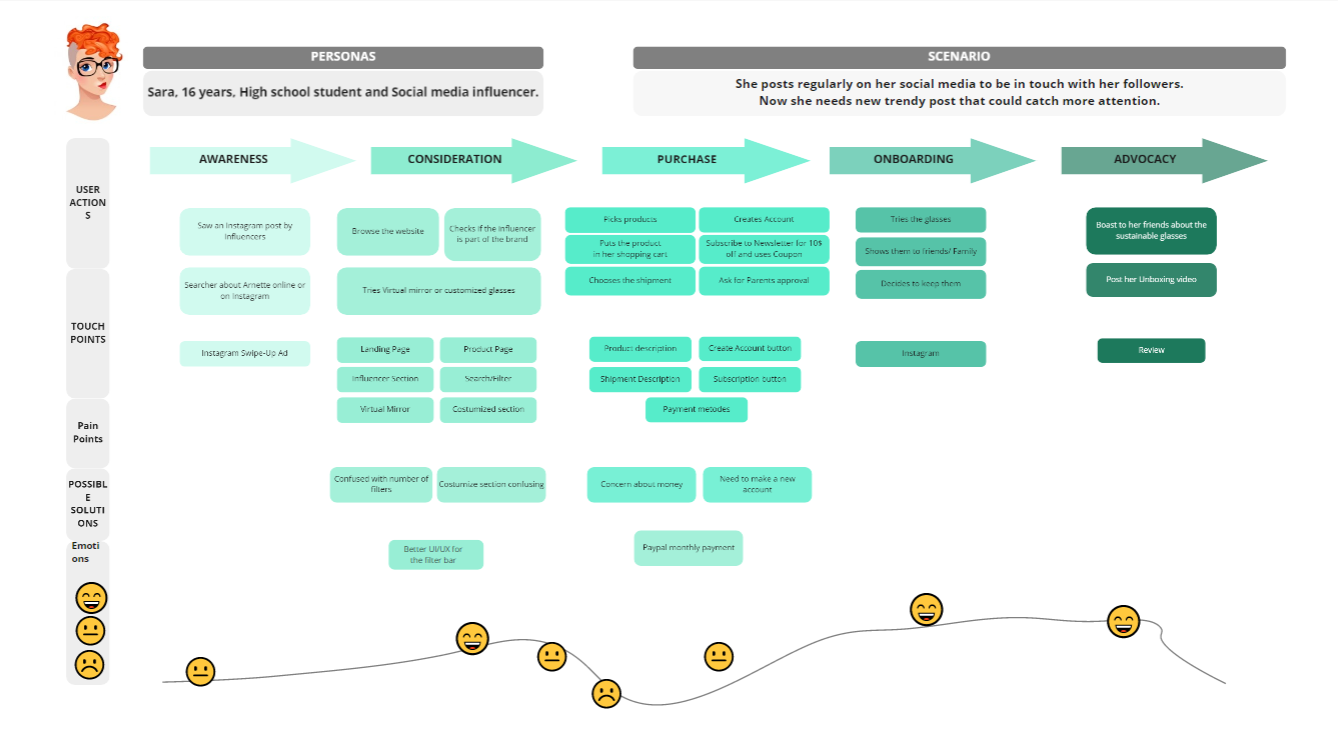 User Journey: Sara
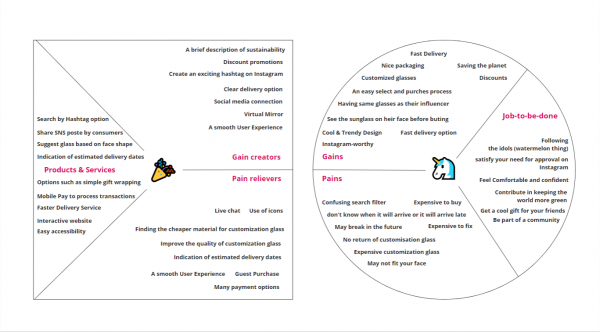
– Value Proposition Canvas
Ideation
After sessions of brainstorming and design charette, we made a list of features, based on new ideas or competitors best practices.
Site Map
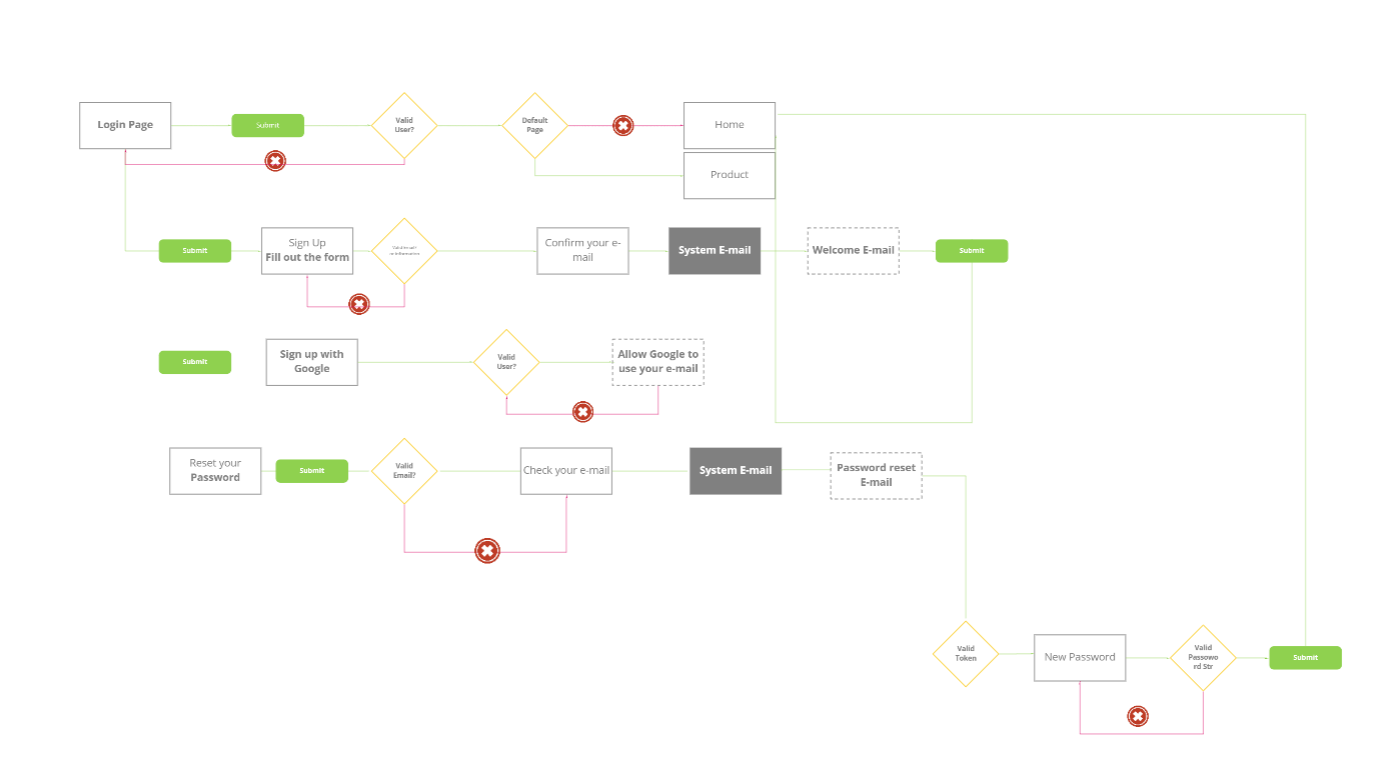 Site Map: Login
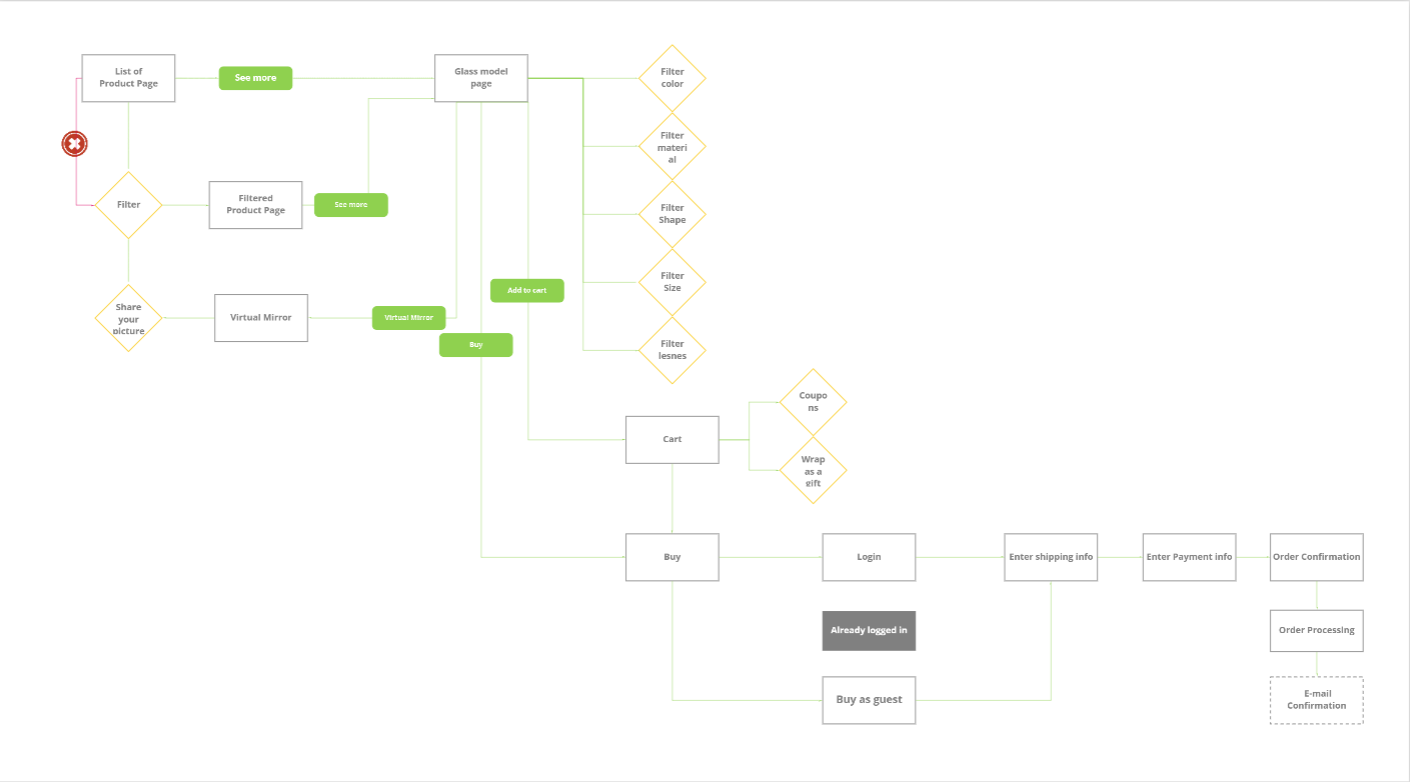 Site Map: Check out
Sketches and Wireframe
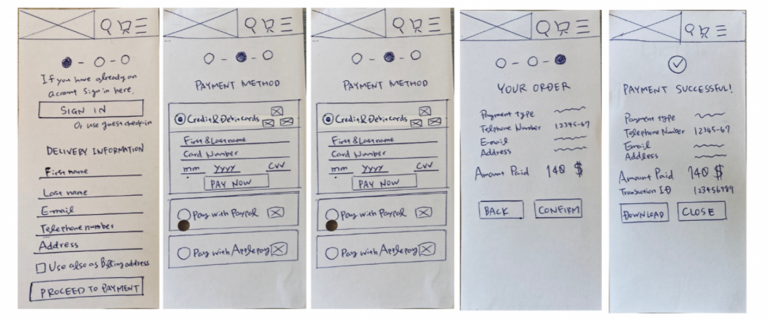 Sample of Sketches: Check out process
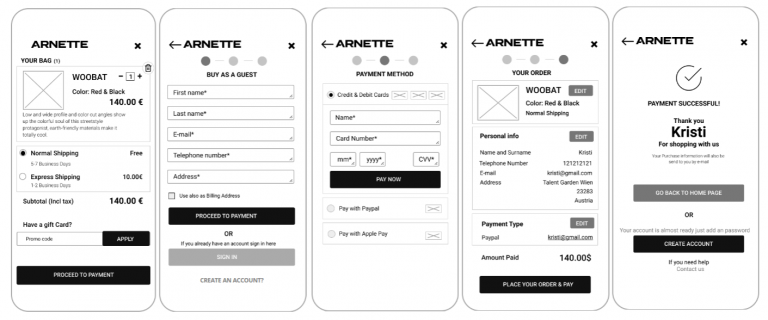 Sample of Low-fidelity Prototype: Check out process
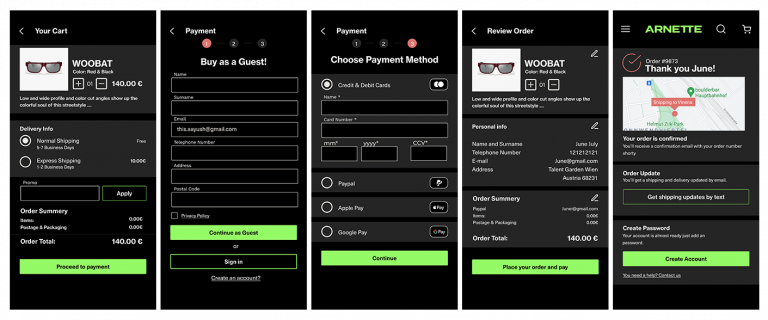 Sample of High-fidelity Prototype: Check out process
Usability Testing
Usability testing session has been conducted remotely with screen sharing, through Teams. In order to preserve the chance of observing the users’ behavior in their own natural setting, the remote sessions have been chosen. Therefore, we had chance to conduct the test with different users based in different locations and with different background. Each test has been observed with 2 different teammates in order to complete the report.
During the test, I have preformed both as interviewer and observer of the test.
Here is 4 different sample of tests:
UX Process
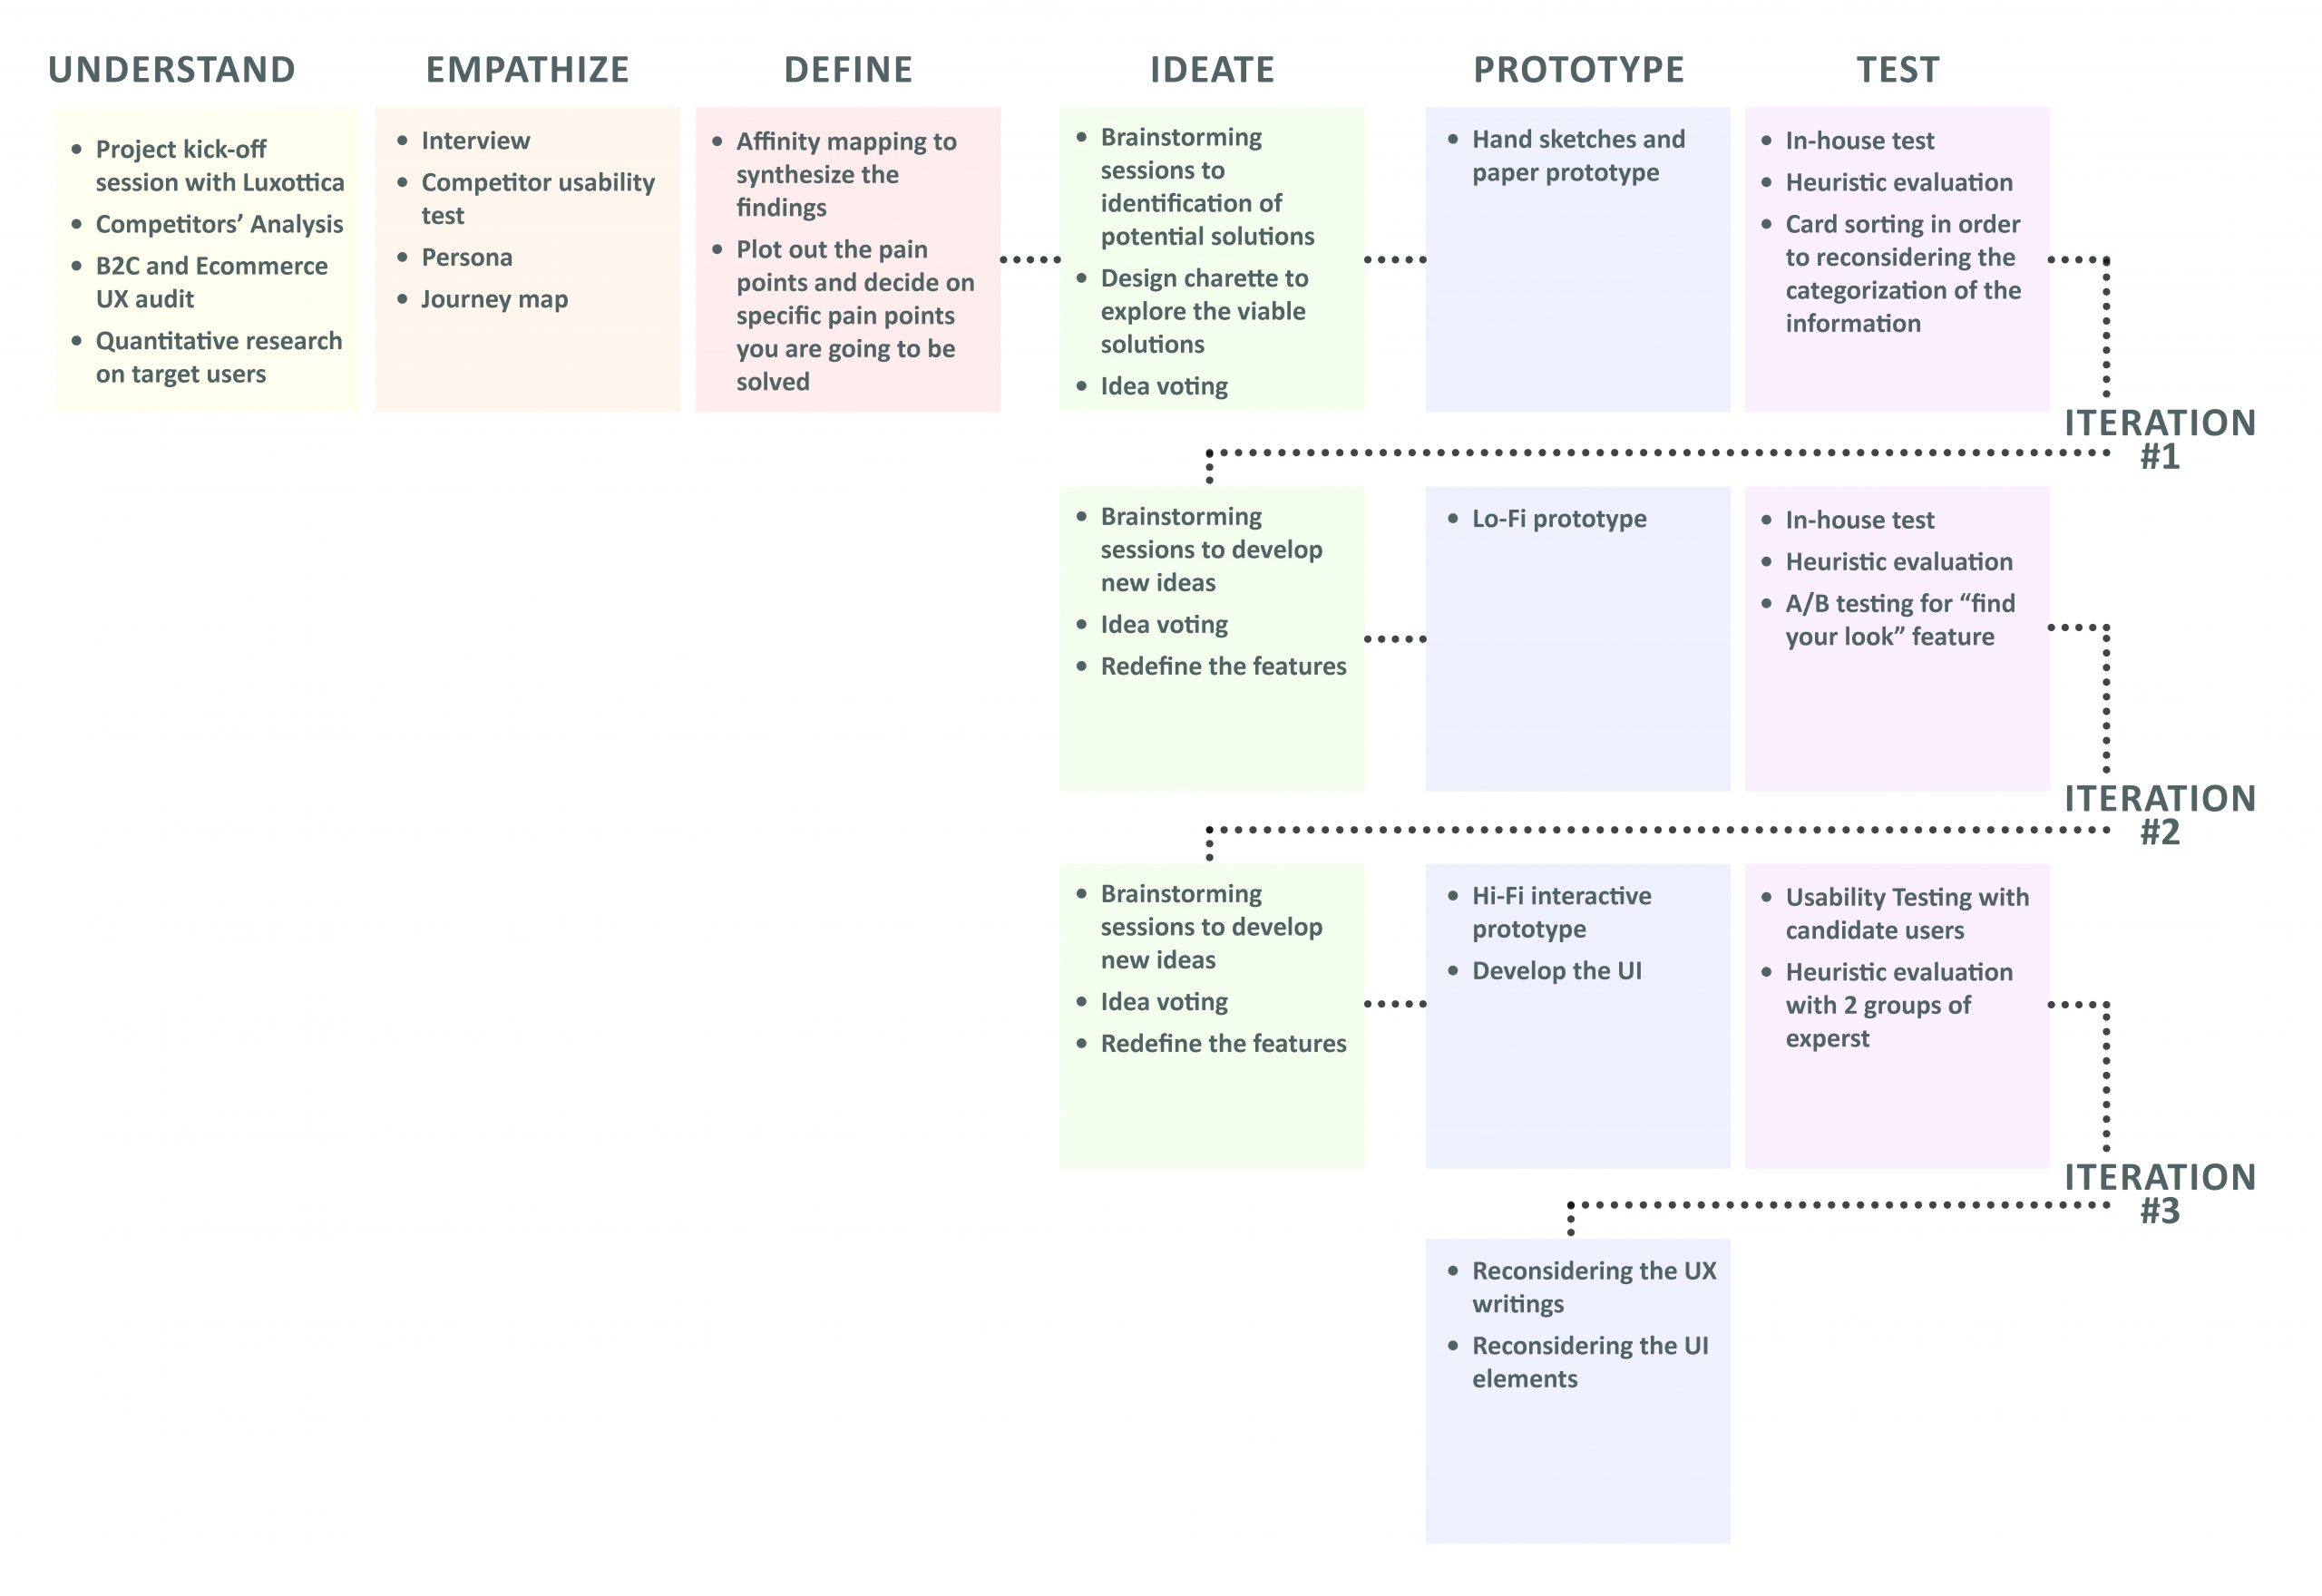 The whole Design Process based from scratch to final prototype